2020-05-06 09:47
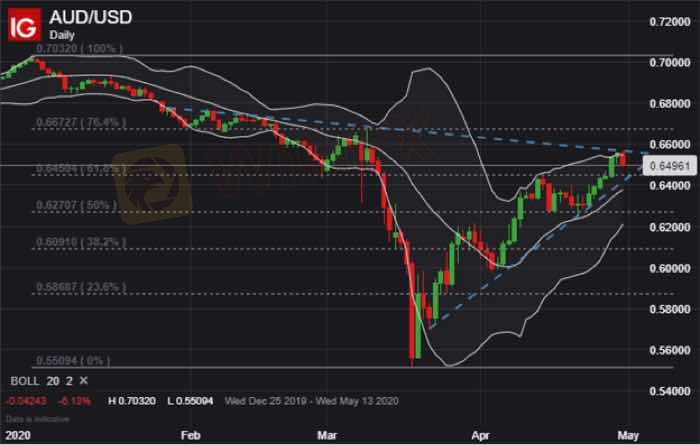
기술 지표AUD/USD PRICE CHART: DAILY TIME FRAME (DECEMBER 20
Zooming in on a daily AUD/USD chart shows the Australian Dollar is already starting to edge lower with a bearish reaction to its upper Bollinger Band near the 0.6500 price level. Technical support, underpinned by the 61.8% Fibonacci retracement of its year-to-date trading range, may provide AUD/USD a degree of buoyancy. Although, Australian Dollar selling pressure could accelerate if spot AUD/USD price action invalidates its short-term bullish trend noted by the recent series of higher lows.
좋아요 1

TPKNX
Participants
인기있는 콘텐츠
시장 분석
투자주체별매매 동향
시장 분석
유로존 경제 쇠퇴 위기 직면
시장 분석
국제 유가는 어디로
시장 분석
미국증시 레버리지(Leverage)·인버스(Inverse)형의 ETF, 최근 사상 최대 신
시장 분석
투기장 된 원유 ETL...첫 투자위험 발령
시장 분석
RBNZ 양적완화 확대
포럼 카테고리

플랫폼

전시회

대리상

신병 모집

EA

업계에서

시장

인덱스


제출
댓글이 아직 없습니다. 첫 번째를 만드십시오.