2021-04-26 11:42
시장 분석Chainlink price bulls not active at current levels, leaving LINK vulnerable to a 25% decline
관련 상품:
외환,기타,기타,기타,기타,기타
시장 분석:
Chainlink price bulls not active at current levels, leaving LINK vulnerable to a 25% decline.
Chainlink price forges descending channel with midline restraining rebounds.
A series of 20% declines in April keeps speculators’ fingers off the buy button.
iTrustCapital, the #1 Crypto IRA platform, announces that LINK is now available on their platform.
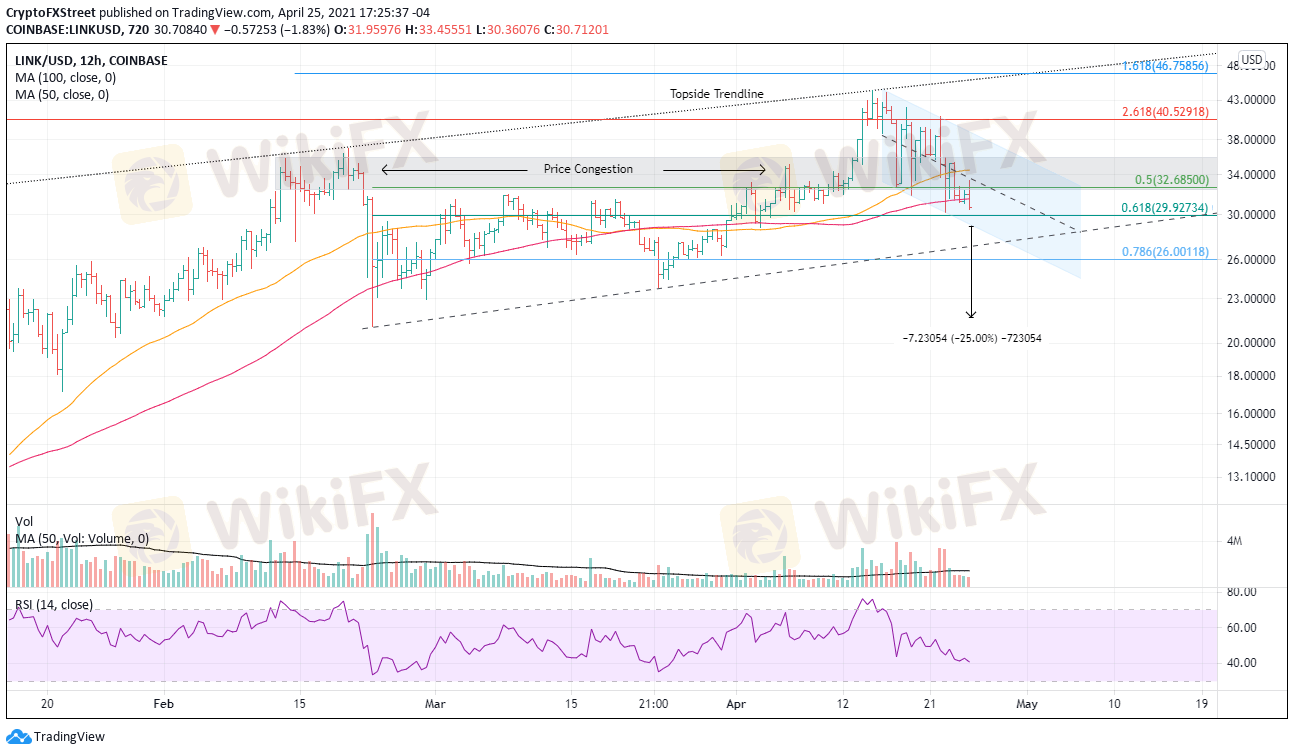
Chainlink price is facing the test of overcoming the momentum of the descending channel and the price congestion between $32.70 and $35.75. A downside trajectory will continue to define the LINK charts in the short term.
Chainlink price looking down for shelter
LINK has been moving at breakneck speed in the cryptocurrency space as the number of projects adopting its oracle grows exponentially. However, the token price has been overwhelmed by the weakness in the broader market, keeping the strong bids on the sidelines.
Despite the selling, LINK does have an impressive range of support between $27.99 and $30.88, according to Intotheblock In/Out of the Money Around Price (IOMAP) data. A total of 46.24k addresses bought 66.48 million LINK. The range extends from just below the lower trend line of the channel to the 100 twelve-hour simple moving average (SMA), suggesting that a significant sell-off from current levels may not occur.
Contrary to the data point above, the charts illustrate a different picture for LINK. Before stalling at the topside trendline at $40.34 in mid-February, the digital token has swung according to the technicals, and that is not likely to change soon.
Note, LINK has crushed support at the 50% retracement of the February decline at $32.68, the 50-day SMA at $31.39, and got within a percent of the 61.8% Fibonacci retracement. The next critical support is the channel’s lower trend line at $28.90. A daily close below the trend line will usher in a test of the rising trend line from the February low at $27.10.
More significant losses could follow, including a test of the March 24 low at $23.75 and lastly, the channel’s measured move target at $21.68, representing a loss of 25% from the channel’s lower trend line.
Rey
交易者
인기있는 콘텐츠
시장 분석
투자주체별매매 동향
시장 분석
유로존 경제 쇠퇴 위기 직면
시장 분석
국제 유가는 어디로
시장 분석
미국증시 레버리지(Leverage)·인버스(Inverse)형의 ETF, 최근 사상 최대 신
시장 분석
투기장 된 원유 ETL...첫 투자위험 발령
시장 분석
RBNZ 양적완화 확대
포럼 카테고리

플랫폼

전시회

대리상

신병 모집

EA

업계에서

시장

인덱스
Chainlink price bulls not active at current levels, leaving LINK vulnerable to a 25% decline
 영국 | 2021-04-26 11:42
Chainlink price bulls not active at current levels, leaving LINK vulnerable to a 25% decline.
Chainlink price forges descending channel with midline restraining rebounds.
A series of 20% declines in April keeps speculators’ fingers off the buy button.
iTrustCapital, the #1 Crypto IRA platform, announces that LINK is now available on their platform.
Chainlink price is facing the test of overcoming the momentum of the descending channel and the price congestion between $32.70 and $35.75. A downside trajectory will continue to define the LINK charts in the short term.
Chainlink price looking down for shelter
LINK has been moving at breakneck speed in the cryptocurrency space as the number of projects adopting its oracle grows exponentially. However, the token price has been overwhelmed by the weakness in the broader market, keeping the strong bids on the sidelines.
Despite the selling, LINK does have an impressive range of support between $27.99 and $30.88, according to Intotheblock In/Out of the Money Around Price (IOMAP) data. A total of 46.24k addresses bought 66.48 million LINK. The range extends from just below the lower trend line of the channel to the 100 twelve-hour simple moving average (SMA), suggesting that a significant sell-off from current levels may not occur.
Contrary to the data point above, the charts illustrate a different picture for LINK. Before stalling at the topside trendline at $40.34 in mid-February, the digital token has swung according to the technicals, and that is not likely to change soon.
Note, LINK has crushed support at the 50% retracement of the February decline at $32.68, the 50-day SMA at $31.39, and got within a percent of the 61.8% Fibonacci retracement. The next critical support is the channel’s lower trend line at $28.90. A daily close below the trend line will usher in a test of the rising trend line from the February low at $27.10.
More significant losses could follow, including a test of the March 24 low at $23.75 and lastly, the channel’s measured move target at $21.68, representing a loss of 25% from the channel’s lower trend line.
외환
기타
기타
기타
기타
기타
좋아요 0
나 도 댓 글 달 래.
제출
0코멘트

댓글이 아직 없습니다. 첫 번째를 만드십시오.

제출
댓글이 아직 없습니다. 첫 번째를 만드십시오.