
2025-01-29 02:16
업계Candlestick trading
#firstdealofthenewyearchewbacca#
Candlestick trading is a popular method of analyzing and predicting market price movements in financial markets such as stocks, forex, and cryptocurrencies. It uses candlestick charts, which visually represent price data over a specific time frame. Each candlestick provides four key pieces of information:
1. Open: The price at which the asset started trading during the time period.
2. High: The highest price reached during the time period.
3. Low: The lowest price reached during the time period.
4. Close: The price at which the asset ended trading during the time period.
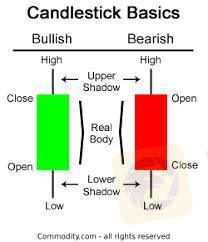
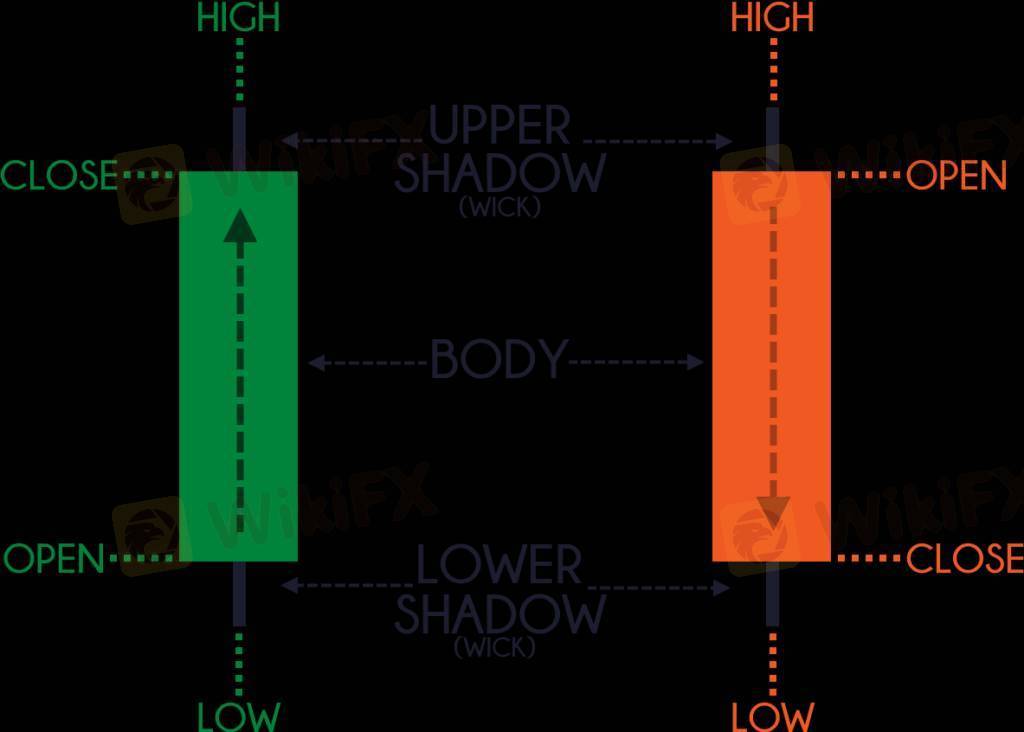
Components of a Candlestick
Body: The rectangular part of the candlestick represents the difference between the opening and closing prices.
Bullish Candle: If the closing price is higher than the opening price, the candle is typically green or white.
Bearish Candle: If the closing price is lower than the opening price, the candle is typically red or black.
Wicks/Shadows: The thin lines above and below the body show the high and low prices during the time period.
Common Candlestick Patterns
Candlestick patterns are categorized into reversal patterns and continuation patterns. Here are a few examples:
Reversal Patterns
1. Hammer: A small body near the top with a long lower wick, signaling potential bullish reversal.
2. Shooting Star: A small body near the bottom with a long upper wick, signaling potential bearish reversal.
3. Engulfing Pattern:
Bullish Engulfing: A small red candle followed by a larger green candle that "engulfs" the previous one.
Bearish Engulfing: A small green candle followed by a larger red candle that "engulfs" the previous one.
Continuation Patterns
1. Doji: A candle where the open and close prices are nearly the same, indicating indecision in the market.
2. Morning Star: A three-candle pattern signaling a bullish continuation.
3. Evening Star: A three-candle pattern signaling a bearish continuation.
Advantages of Candlestick Trading
Easy to read and interpret visually.
Provides insights into market sentiment.
Works well with other technical indicators (e.g., moving averages, RSI).
Limitations
Requires practice to interpret correctly.
Patterns may not always predict price movement accurately.
Works best when combined with other tools and analysis methods.
좋아요 0

FX1816125491
ブローカー
인기있는 콘텐츠
시장 분석
투자주체별매매 동향
시장 분석
유로존 경제 쇠퇴 위기 직면
시장 분석
국제 유가는 어디로
시장 분석
미국증시 레버리지(Leverage)·인버스(Inverse)형의 ETF, 최근 사상 최대 신
시장 분석
투기장 된 원유 ETL...첫 투자위험 발령
시장 분석
RBNZ 양적완화 확대
포럼 카테고리

플랫폼

전시회

IB

모집

EA

업계

시세

인덱스
Candlestick trading
나이지리아 | 2025-01-29 02:16#firstdealofthenewyearchewbacca#
Candlestick trading is a popular method of analyzing and predicting market price movements in financial markets such as stocks, forex, and cryptocurrencies. It uses candlestick charts, which visually represent price data over a specific time frame. Each candlestick provides four key pieces of information:
1. Open: The price at which the asset started trading during the time period.
2. High: The highest price reached during the time period.
3. Low: The lowest price reached during the time period.
4. Close: The price at which the asset ended trading during the time period.
Components of a Candlestick
Body: The rectangular part of the candlestick represents the difference between the opening and closing prices.
Bullish Candle: If the closing price is higher than the opening price, the candle is typically green or white.
Bearish Candle: If the closing price is lower than the opening price, the candle is typically red or black.
Wicks/Shadows: The thin lines above and below the body show the high and low prices during the time period.
Common Candlestick Patterns
Candlestick patterns are categorized into reversal patterns and continuation patterns. Here are a few examples:
Reversal Patterns
1. Hammer: A small body near the top with a long lower wick, signaling potential bullish reversal.
2. Shooting Star: A small body near the bottom with a long upper wick, signaling potential bearish reversal.
3. Engulfing Pattern:
Bullish Engulfing: A small red candle followed by a larger green candle that "engulfs" the previous one.
Bearish Engulfing: A small green candle followed by a larger red candle that "engulfs" the previous one.
Continuation Patterns
1. Doji: A candle where the open and close prices are nearly the same, indicating indecision in the market.
2. Morning Star: A three-candle pattern signaling a bullish continuation.
3. Evening Star: A three-candle pattern signaling a bearish continuation.
Advantages of Candlestick Trading
Easy to read and interpret visually.
Provides insights into market sentiment.
Works well with other technical indicators (e.g., moving averages, RSI).
Limitations
Requires practice to interpret correctly.
Patterns may not always predict price movement accurately.
Works best when combined with other tools and analysis methods.
좋아요 0
나 도 댓 글 달 래.
제출
0코멘트

댓글이 아직 없습니다. 첫 번째를 만드십시오.
제출
댓글이 아직 없습니다. 첫 번째를 만드십시오.