2025-01-29 17:09
Na indústriaIntroduction to Stochastic Oscillators in Forex
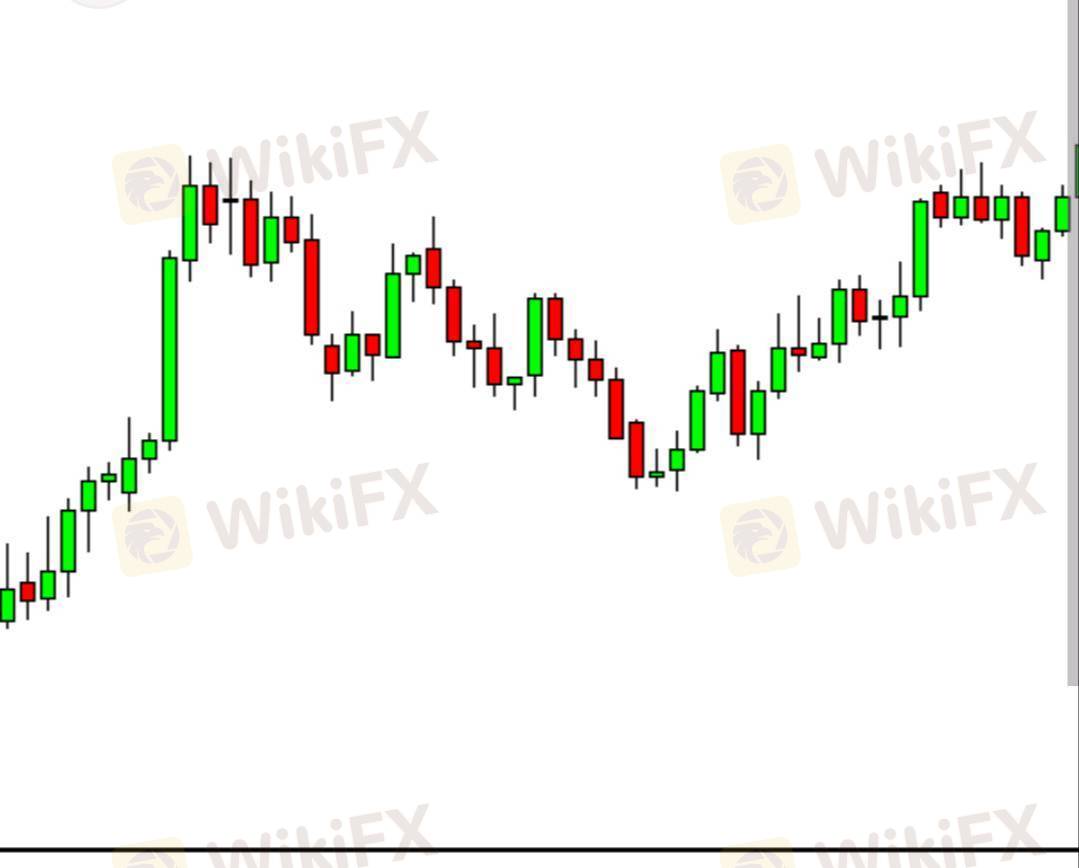
A Stochastic Oscillator in Forex is a momentum indicator used to identify potential trend reversals by comparing a currency pair's closing price to its recent price range over a specified period, typically indicating overbought or oversold conditions when the reading falls above 80 or below 20 respectively, helping traders anticipate potential price corrections; it is represented by two lines, %K (fast line) and %D (slow line), with buy signals often occurring when the %K line crosses above the %D line from below and sell signals when it crosses below the %D line from above.
Gostar 0
FX2489435150
Trader
Discussões populares
Análise de mercado
Brasileiros FX
Análise de mercado
Brasileiros no FOREX
Análise de mercado
Don't buy Bitcoin now! Look at my review and description in the print!
Análise de mercado
análises do mercado financeiro ao vivo confira
Na indústria
Não consegui sacar meus peofits
Na indústria
Não é possível retirar
Categoria do mercado

Plataforma

Exibições

IB

Recrutamento

EA

Na indústria

Mercado

Índice
Introduction to Stochastic Oscillators in Forex
 Nigéria | 2025-01-29 17:09
A Stochastic Oscillator in Forex is a momentum indicator used to identify potential trend reversals by comparing a currency pair's closing price to its recent price range over a specified period, typically indicating overbought or oversold conditions when the reading falls above 80 or below 20 respectively, helping traders anticipate potential price corrections; it is represented by two lines, %K (fast line) and %D (slow line), with buy signals often occurring when the %K line crosses above the %D line from below and sell signals when it crosses below the %D line from above.
Gostar 0
Também quero comentar.
Perguntar
0Comentários

Ainda não há comentários. Faça o primeiro.

Perguntar
Ainda não há comentários. Faça o primeiro.