
2020-04-18 15:20
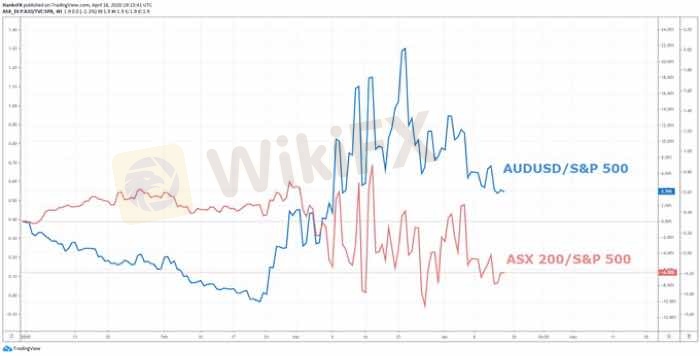
Технический показательAUD/USD & ASX 200 PRICE CHARTS RELATIVE TO S&P 500
Evidenced in the chart below, the Australian Dollar has considerably outperformed the ASX 200 relative to one of the other leading risk assets, the S&P 500. Using the US index as a benchmark, we can see not only the divergence between the two Australian assets, but also the formidable strength of the S&P 500 which has outperformed both AUD/USD and the ASX 200 since mid-March.
Нравится 2

TPKNX
Người hành nghề
Популярные обсуждения
Технический показатель
Розыгрыш Xiaomi Redmi Note 9 и 20-и VIP-подписок
Технический показатель
ВЫСКАЗЫВАНИЯ БАЙДЕНА ДАВЯТ НА ВАЛЮТЫ РАЗВИВАЮЩИХСЯ СТРАН
Технический показатель
Европа заключила совместный контракт на поставку ремдесивира для лечения COVID-19...
Технический показатель
Индия: Решение Резерв. Банка Индии по проц. ставке, 4%, ожидалось 4%...
Анализ котировок
Китай: Индекс деловой актив. в сф. услуг Caixin PMI, Сентябрь, 54,8 п.
Технический показатель
События предстоящего дня: "АЛРОСА" опубликует результаты продаж за сентябрь...
Классификация рынка

Платфоома

Выставка

Агент

Вакансии

EA

Отраслевой

Котировки

Показатель
AUD/USD & ASX 200 PRICE CHARTS RELATIVE TO S&P 500
Соединенные Штаты Америки | 2020-04-18 15:20Нравится 2
Я тоже хочу высказать замечания.
Задать вопрос
0Комментарии

Пока нет комментариев, оставьте комментарий первым
Задать вопрос
Пока нет комментариев, оставьте комментарий первым