2024-11-07 17:22
ОтраслевойCandle Patterns – Reversal
In this section we will cover chart patterns, these are patterns that are comprised of many candles and take considerably more time to form. Once again, there are multitudes of chart patterns to draw up on your MT4 platform, so we will try to only cover the more common and reliable patterns.
Head and Shoulders – Bearish Reversal Pattern
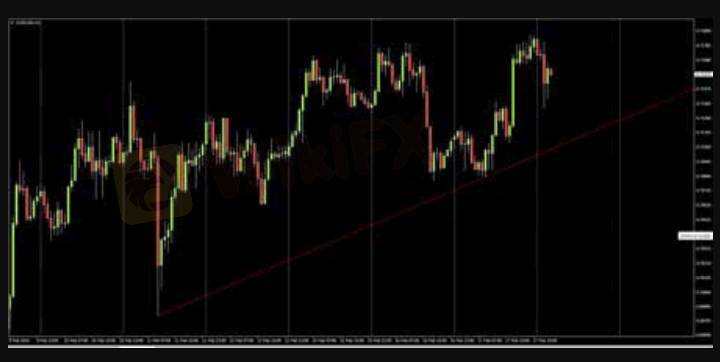
This is by far one of the most common and easy to recognise chart patterns, it is also the most reliable. Forex traders love these patterns for both their reliability and the fact they offer clear entry and stop loss levels:
These patterns have four components:
Left Shoulder – small rounded top. Pattern is not yet visible
Head – Pair breaks above the left shoulder before retracing 100%, or the majority of the ascent – potential pattern visible to the keen eyed chart trader
Right Shoulder – pair forms a lower high to the right of the head, usually similar magnitude to left shoulder, but variance is not uncommon. Head and Shoulders top is now clearly visible.
Neckline – Though the chart pattern is now clearly visible, it is not a confirmed top until there is a break below the neckline. The Neckline connects the lows of the left and right shoulders. This is often a straight line, though in the above example it is ascending – patterns with ascending necklines are even more reliable than the standard, flat neckline Head and houlders.
Once price breaches the neckline, the trader enters short. Stop can be placed above the right shoulder, or above the head (depending on your risk tolerance). Note that price often comes back to test the underside of the neckline – this can be very handy if you’ve missed the original break and reinforces bearish bias. In this example, once price breaches the neckline, there is a ecline of over 100 pips.
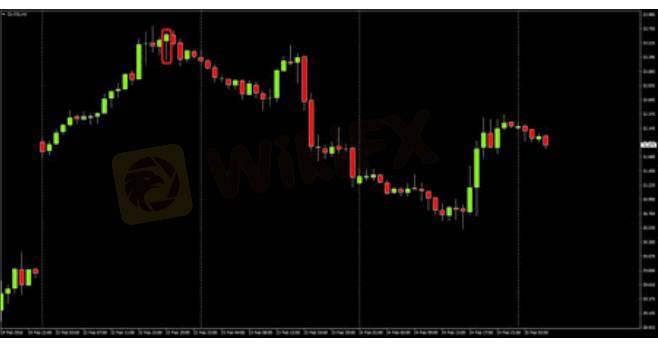
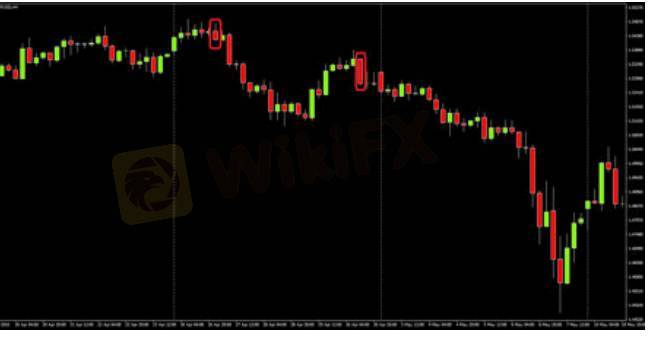
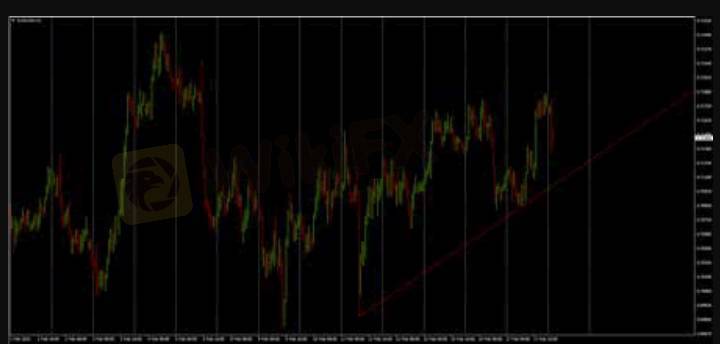
Deformed Head & Shoulders – the above example was very clean, though some times, these patterns can exhibit ‘deformities’ such as dual or multiple right shoulders, descending neck lines or shoulders that exceed the top. Cleaner patters tend to be more reliable, though the key to a successful trade is always waiting til the pattern is confirmed ie the Neckline breaks. Here are some examples of the above deformities:
Head and Shoulders patterns are extremely reliable and offer the trader clear entry and exit points, but always remember – the setup is not confirmed until the neckline is breached.
Inverse Head and Shoulders – Bullish Reversal Pattern
As the name suggests, these patterns are identical to a standard Head and Shoulders, but appear upside down (on their heads) and signify a potential bottom. Not quite as reliable as the standard H&S, but still a very reliable pattern. These patterns are often more difficult to spot than their bearish counterparts, but recognition becomes easier as you gain charting experience.
Once again, the key here is waiting til the neckline is breached.
Double Top – Bearish Reversal Pattern
The Double Top or ‘M’, is another reliable chart pattern favoured by many traders. Like the H&S, it offers the trader clear entry and stop loss levels. With the Double Top, the entry trigger is known as the Confirmation Line:
The Double Top is characterized by two tops of similar magnitudes, originating from roughly the same point. The Confirmation Line connects the two origin points and tends to be flat or ascending at a slight gradient. Just like the H&S, the trader does not enter short until the Confirmation Line is breached and the top is confirmed. Note the two tops often take the shape of H&S or smaller double top patterns (this M features the two H&S examples from earlier).
Double Bottom – Bullish Reversal Pattern
The Double Bottom or ‘W’ is the inverse of the Double Top – it’s shape is reminiscent of the letter ‘W’ and the pattern signals a potential bottom.
As with the other reversal patterns we’ve covered, the trader waits until the Confirmation Line is breached before entering a Buy position.
Нравится 0

用生命在耍帅
Mangangalakal
Популярные обсуждения
Технический показатель
Розыгрыш Xiaomi Redmi Note 9 и 20-и VIP-подписок
Технический показатель
ВЫСКАЗЫВАНИЯ БАЙДЕНА ДАВЯТ НА ВАЛЮТЫ РАЗВИВАЮЩИХСЯ СТРАН
Технический показатель
Европа заключила совместный контракт на поставку ремдесивира для лечения COVID-19...
Анализ котировок
Китай: Индекс деловой актив. в сф. услуг Caixin PMI, Сентябрь, 54,8 п.
Технический показатель
Индия: Решение Резерв. Банка Индии по проц. ставке, 4%, ожидалось 4%...
Технический показатель
События предстоящего дня: "АЛРОСА" опубликует результаты продаж за сентябрь...
Классификация рынка

Платфоома

Выставка

Агент

Вакансии

EA

Отраслевой

Котировки

Показатель
Candle Patterns – Reversal
 | 2024-11-07 17:22
In this section we will cover chart patterns, these are patterns that are comprised of many candles and take considerably more time to form. Once again, there are multitudes of chart patterns to draw up on your MT4 platform, so we will try to only cover the more common and reliable patterns.
Head and Shoulders – Bearish Reversal Pattern
This is by far one of the most common and easy to recognise chart patterns, it is also the most reliable. Forex traders love these patterns for both their reliability and the fact they offer clear entry and stop loss levels:
These patterns have four components:
Left Shoulder – small rounded top. Pattern is not yet visible
Head – Pair breaks above the left shoulder before retracing 100%, or the majority of the ascent – potential pattern visible to the keen eyed chart trader
Right Shoulder – pair forms a lower high to the right of the head, usually similar magnitude to left shoulder, but variance is not uncommon. Head and Shoulders top is now clearly visible.
Neckline – Though the chart pattern is now clearly visible, it is not a confirmed top until there is a break below the neckline. The Neckline connects the lows of the left and right shoulders. This is often a straight line, though in the above example it is ascending – patterns with ascending necklines are even more reliable than the standard, flat neckline Head and houlders.
Once price breaches the neckline, the trader enters short. Stop can be placed above the right shoulder, or above the head (depending on your risk tolerance). Note that price often comes back to test the underside of the neckline – this can be very handy if you’ve missed the original break and reinforces bearish bias. In this example, once price breaches the neckline, there is a ecline of over 100 pips.
Deformed Head & Shoulders – the above example was very clean, though some times, these patterns can exhibit ‘deformities’ such as dual or multiple right shoulders, descending neck lines or shoulders that exceed the top. Cleaner patters tend to be more reliable, though the key to a successful trade is always waiting til the pattern is confirmed ie the Neckline breaks. Here are some examples of the above deformities:
Head and Shoulders patterns are extremely reliable and offer the trader clear entry and exit points, but always remember – the setup is not confirmed until the neckline is breached.
Inverse Head and Shoulders – Bullish Reversal Pattern
As the name suggests, these patterns are identical to a standard Head and Shoulders, but appear upside down (on their heads) and signify a potential bottom. Not quite as reliable as the standard H&S, but still a very reliable pattern. These patterns are often more difficult to spot than their bearish counterparts, but recognition becomes easier as you gain charting experience.
Once again, the key here is waiting til the neckline is breached.
Double Top – Bearish Reversal Pattern
The Double Top or ‘M’, is another reliable chart pattern favoured by many traders. Like the H&S, it offers the trader clear entry and stop loss levels. With the Double Top, the entry trigger is known as the Confirmation Line:
The Double Top is characterized by two tops of similar magnitudes, originating from roughly the same point. The Confirmation Line connects the two origin points and tends to be flat or ascending at a slight gradient. Just like the H&S, the trader does not enter short until the Confirmation Line is breached and the top is confirmed. Note the two tops often take the shape of H&S or smaller double top patterns (this M features the two H&S examples from earlier).
Double Bottom – Bullish Reversal Pattern
The Double Bottom or ‘W’ is the inverse of the Double Top – it’s shape is reminiscent of the letter ‘W’ and the pattern signals a potential bottom.
As with the other reversal patterns we’ve covered, the trader waits until the Confirmation Line is breached before entering a Buy position.
Нравится 0
Я тоже хочу высказать замечания.
Задать вопрос
0Комментарии

Пока нет комментариев, оставьте комментарий первым


Задать вопрос
Пока нет комментариев, оставьте комментарий первым