2024-12-23 13:41
Отраслевой2⃣Doji (Market Indecision) 🤔
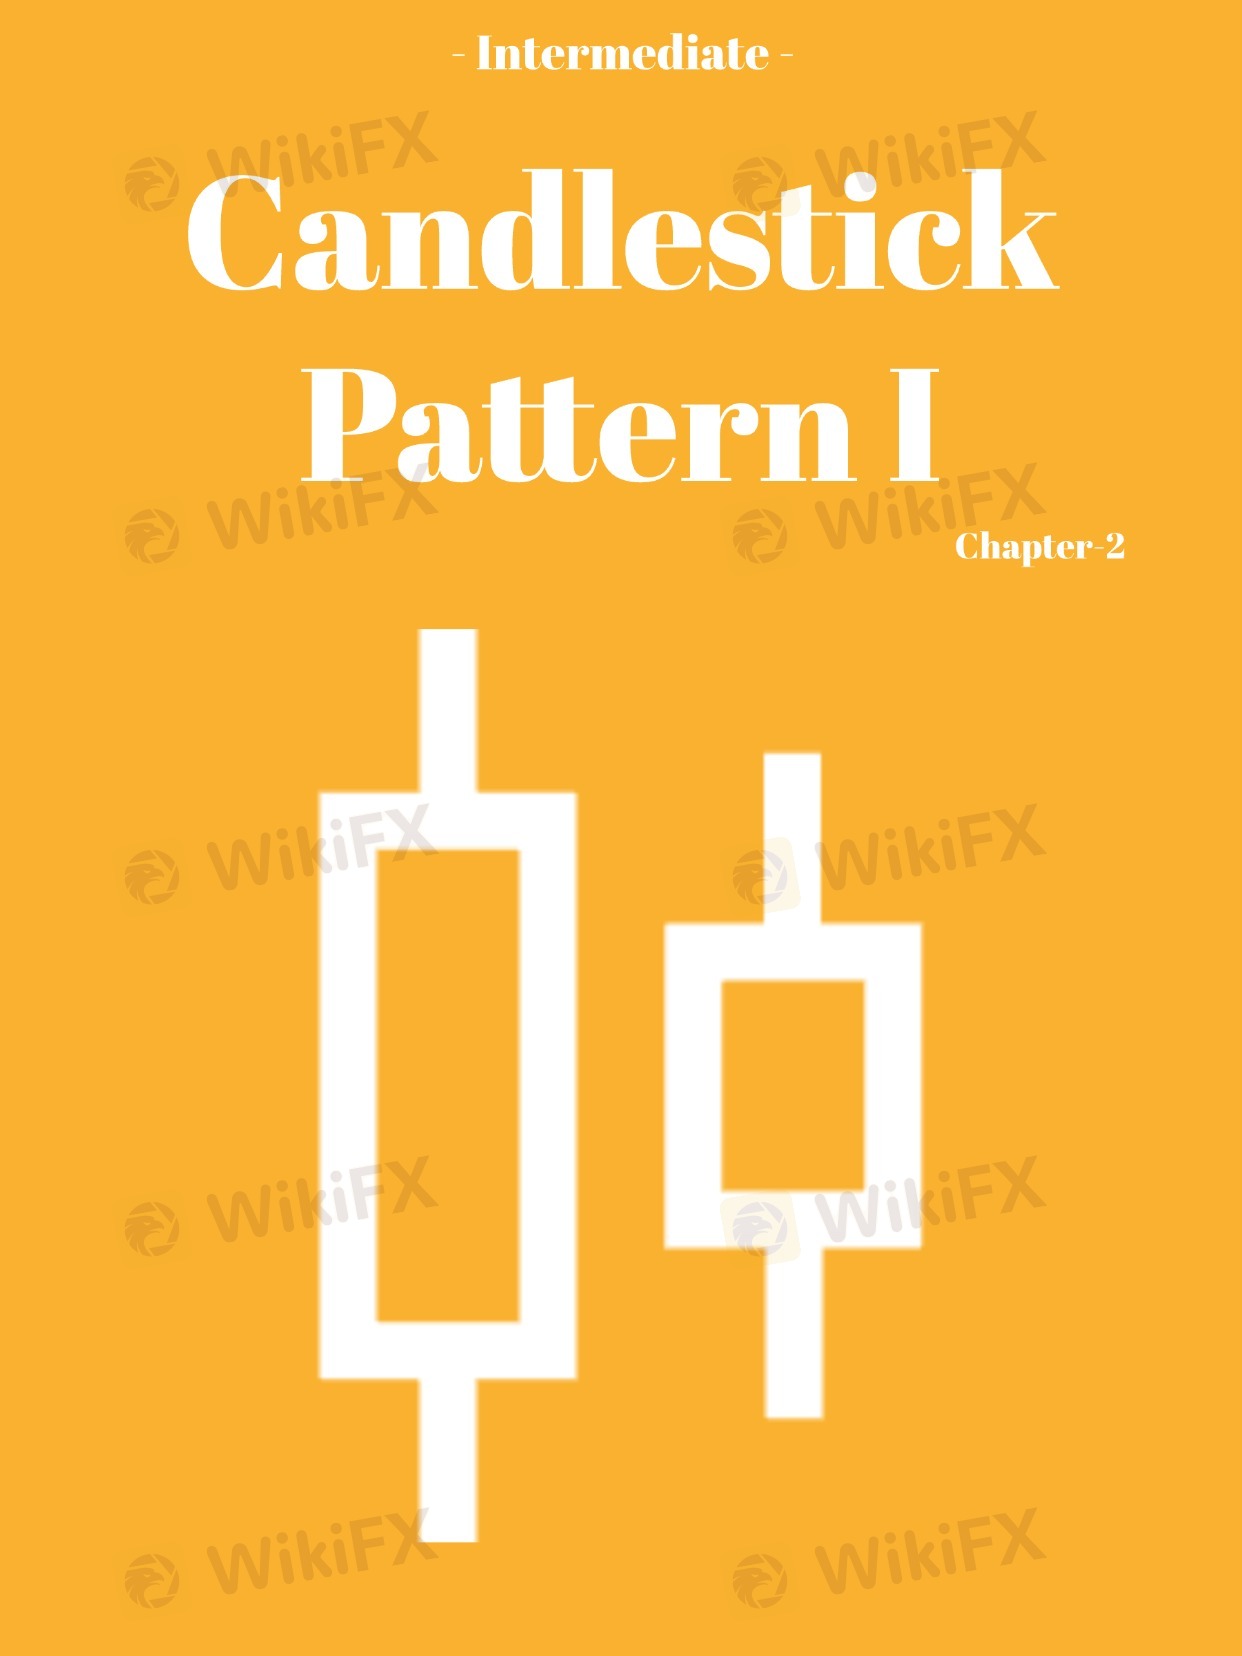
The Doji candlestick is a small body with long wicks, where the opening and closing prices are nearly the same.
This pattern shows that neither buyers nor sellers have control, and the market is in a state of indecision.
Key Point: The Doji by itself is neutral, but it’s often a signal that the current trend may be losing momentum.
The significance of the Doji increases when it occurs after a strong trend, indicating a potential reversal.
Example: After a strong uptrend, a Doji might indicate that the bullish momentum is fading, and the market could be preparing for a reversal.
Conversely, after a downtrend, a Doji could signal that selling pressure is weakening, and the market may start moving upwards.
Нравится 0

Популярные обсуждения
Технический показатель
Розыгрыш Xiaomi Redmi Note 9 и 20-и VIP-подписок
Технический показатель
ВЫСКАЗЫВАНИЯ БАЙДЕНА ДАВЯТ НА ВАЛЮТЫ РАЗВИВАЮЩИХСЯ СТРАН
Технический показатель
Европа заключила совместный контракт на поставку ремдесивира для лечения COVID-19...
Анализ котировок
Китай: Индекс деловой актив. в сф. услуг Caixin PMI, Сентябрь, 54,8 п.
Технический показатель
Индия: Решение Резерв. Банка Индии по проц. ставке, 4%, ожидалось 4%...
Технический показатель
События предстоящего дня: "АЛРОСА" опубликует результаты продаж за сентябрь...
Классификация рынка

Платфоома

Выставка

Агент

Вакансии

EA

Отраслевой

Котировки

Показатель
2⃣Doji (Market Indecision) 🤔
 Гонконг | 2024-12-23 13:41
The Doji candlestick is a small body with long wicks, where the opening and closing prices are nearly the same.
This pattern shows that neither buyers nor sellers have control, and the market is in a state of indecision.
Key Point: The Doji by itself is neutral, but it’s often a signal that the current trend may be losing momentum.
The significance of the Doji increases when it occurs after a strong trend, indicating a potential reversal.
Example: After a strong uptrend, a Doji might indicate that the bullish momentum is fading, and the market could be preparing for a reversal.
Conversely, after a downtrend, a Doji could signal that selling pressure is weakening, and the market may start moving upwards.
Нравится 0
Я тоже хочу высказать замечания.
Задать вопрос
0Комментарии

Пока нет комментариев, оставьте комментарий первым

Задать вопрос
Пока нет комментариев, оставьте комментарий первым