2024-12-24 14:52
Отраслевой5⃣Hanging Man & Hammer (Reversal Patterns) ⛓🔨
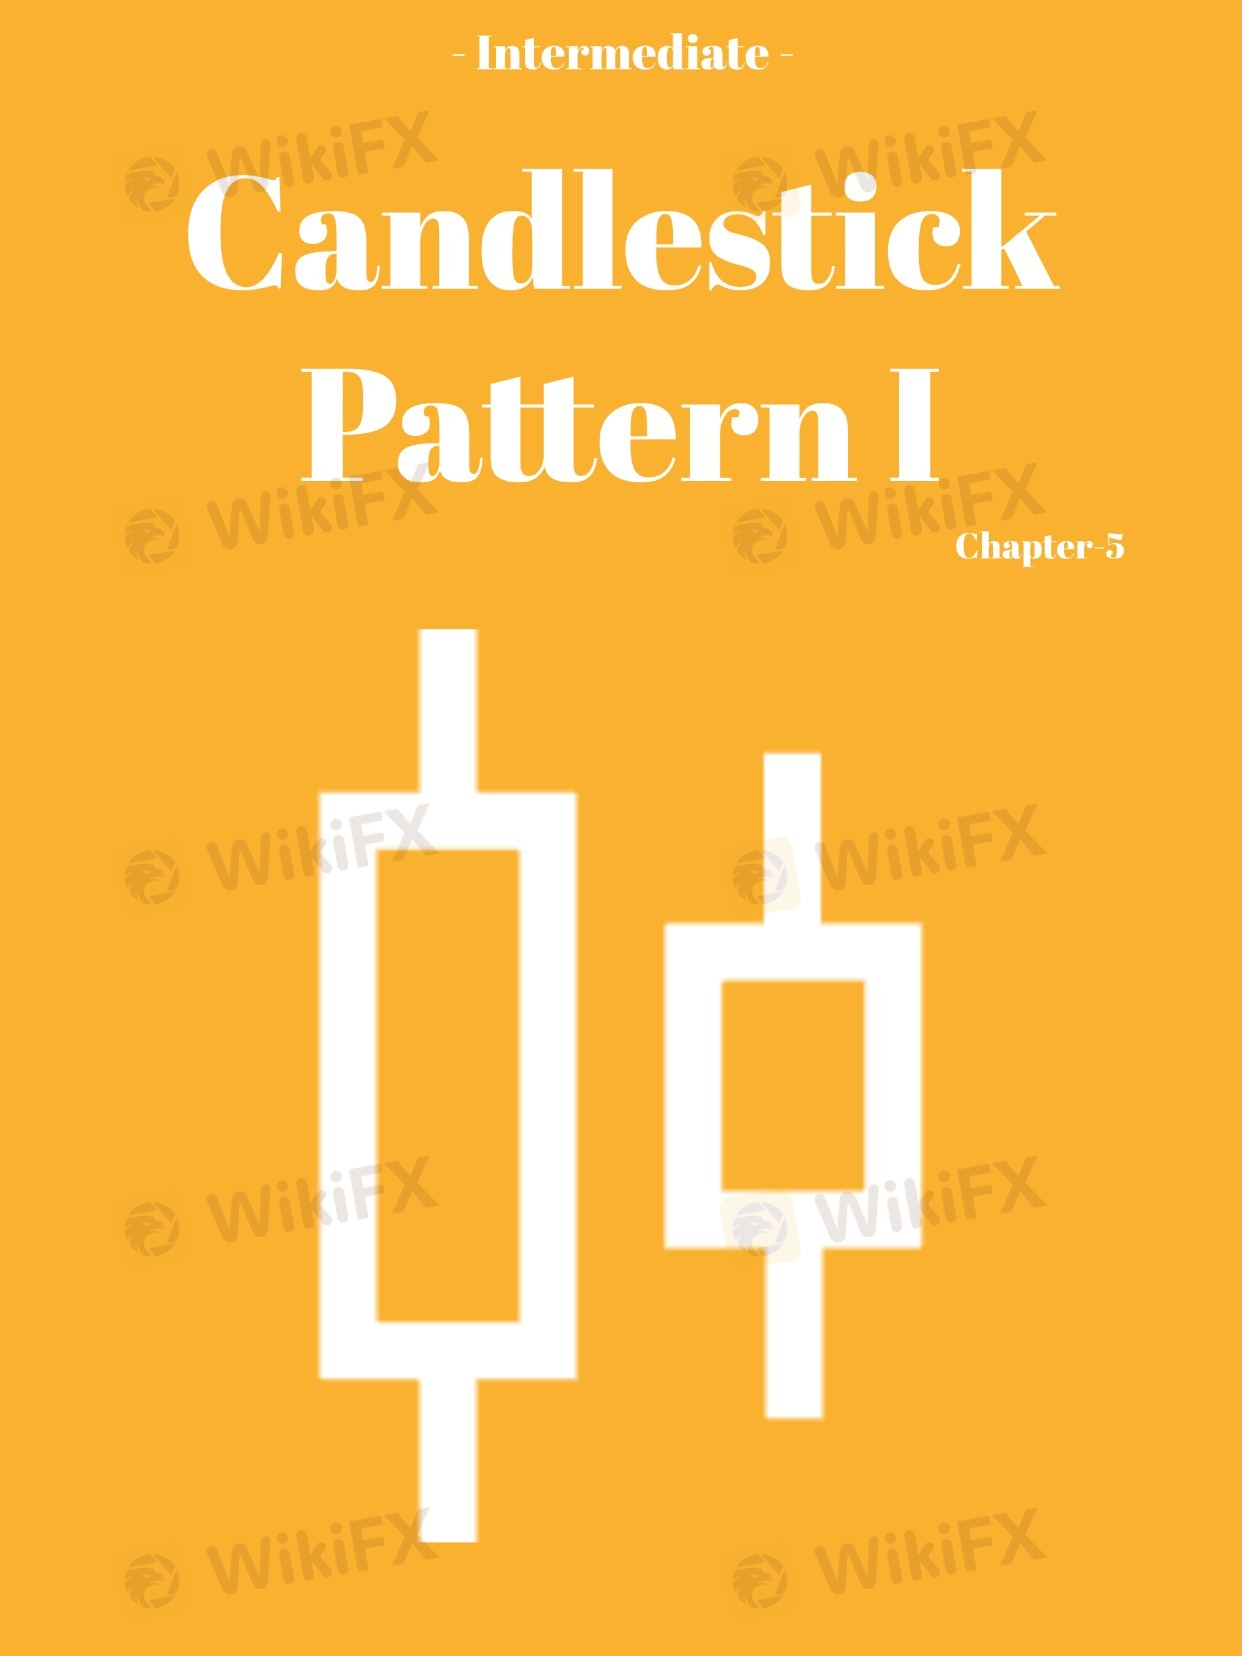
The Hanging Man and Hammer are both candlesticks with small bodies and long lower wicks, but they have different meanings depending on the trend they appear in:
🔹Hammer: Appears during a downtrend and signals a potential bullish reversal. The long lower wick shows that sellers tried to push the price lower, but buyers stepped in and pushed the price back up.
🔹Hanging Man: Appears during an uptrend and signals a potential bearish reversal. The long lower wick shows that while buyers initially pushed the price higher, sellers later took control, pushing the price back down.
Key Point: Both patterns are more reliable when followed by confirmation from the next candlestick. The Hammer suggests that buying is starting to regain control, while the Hanging Man signals that sellers might soon take over.
Example: A Hammer after a downtrend shows that buyers are regaining control, potentially signaling the end of the downtrend. Conversely, a Hanging Man after an uptrend signals that the buying momentum might be weakening, and a reversal could be imminent.
Нравится 0

Популярные обсуждения
Технический показатель
Розыгрыш Xiaomi Redmi Note 9 и 20-и VIP-подписок
Технический показатель
ВЫСКАЗЫВАНИЯ БАЙДЕНА ДАВЯТ НА ВАЛЮТЫ РАЗВИВАЮЩИХСЯ СТРАН
Технический показатель
Европа заключила совместный контракт на поставку ремдесивира для лечения COVID-19...
Технический показатель
Индия: Решение Резерв. Банка Индии по проц. ставке, 4%, ожидалось 4%...
Анализ котировок
Китай: Индекс деловой актив. в сф. услуг Caixin PMI, Сентябрь, 54,8 п.
Технический показатель
События предстоящего дня: "АЛРОСА" опубликует результаты продаж за сентябрь...
Классификация рынка

Платфоома

Выставка

Агент

Вакансии

EA

Отраслевой

Котировки

Показатель
5⃣Hanging Man & Hammer (Reversal Patterns) ⛓🔨
 Гонконг | 2024-12-24 14:52
The Hanging Man and Hammer are both candlesticks with small bodies and long lower wicks, but they have different meanings depending on the trend they appear in:
🔹Hammer: Appears during a downtrend and signals a potential bullish reversal. The long lower wick shows that sellers tried to push the price lower, but buyers stepped in and pushed the price back up.
🔹Hanging Man: Appears during an uptrend and signals a potential bearish reversal. The long lower wick shows that while buyers initially pushed the price higher, sellers later took control, pushing the price back down.
Key Point: Both patterns are more reliable when followed by confirmation from the next candlestick. The Hammer suggests that buying is starting to regain control, while the Hanging Man signals that sellers might soon take over.
Example: A Hammer after a downtrend shows that buyers are regaining control, potentially signaling the end of the downtrend. Conversely, a Hanging Man after an uptrend signals that the buying momentum might be weakening, and a reversal could be imminent.
Нравится 0
Я тоже хочу высказать замечания.
Задать вопрос
0Комментарии

Пока нет комментариев, оставьте комментарий первым

Задать вопрос
Пока нет комментариев, оставьте комментарий первым