
2025-01-30 18:31
ОтраслевойUsing Bollinger Bands in Crypto Trading
#firstdealofthenewyearFateema
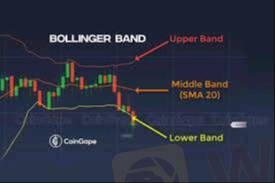
Bollinger Bands are a popular technical analysis tool used in crypto trading to identify potential price breakouts, overbought and oversold conditions, and market volatility. They consist of three lines:
1. Middle Band – A simple moving average (SMA), typically set to 20 periods.
2. Upper Band – Calculated as the SMA plus two standard deviations.
3. Lower Band – Calculated as the SMA minus two standard deviations.
How to Use Bollinger Bands in Crypto Trading
1. Identifying Overbought and Oversold Conditions
Price Near Upper Band → The asset may be overbought, signaling a potential pullback.
Price Near Lower Band → The asset may be oversold, indicating a possible bounce.
2. Bollinger Band Squeeze (Volatility Indicator)
Bands Contracting → Low volatility, possible upcoming breakout.
Bands Expanding → Increased volatility, confirming a trend continuation.
3. Breakout Trading Strategy
If the price breaks above the upper band with strong volume, it may signal a bullish breakout.
If the price breaks below the lower band with strong volume, it may indicate a bearish breakout.
4. Using Bollinger Bands with Other Indicators
RSI (Relative Strength Index): Confirms overbought/oversold conditions.
MACD (Moving Average Convergence Divergence): Helps validate breakout signals.
Support & Resistance Levels: Avoid false breakouts by checking key price levels.
Limitations
False signals can occur, so always combine Bollinger Bands with other indicators.
Does not predict trend direction, only volatility changes.
Would you like insights on applying Bollinger Bands in specific market conditions or assets?
Нравится 0

Estybest
Трейдер
Популярные обсуждения
Технический показатель
Розыгрыш Xiaomi Redmi Note 9 и 20-и VIP-подписок
Технический показатель
ВЫСКАЗЫВАНИЯ БАЙДЕНА ДАВЯТ НА ВАЛЮТЫ РАЗВИВАЮЩИХСЯ СТРАН
Технический показатель
Европа заключила совместный контракт на поставку ремдесивира для лечения COVID-19...
Анализ котировок
Китай: Индекс деловой актив. в сф. услуг Caixin PMI, Сентябрь, 54,8 п.
Технический показатель
Индия: Решение Резерв. Банка Индии по проц. ставке, 4%, ожидалось 4%...
Технический показатель
События предстоящего дня: "АЛРОСА" опубликует результаты продаж за сентябрь...
Классификация рынка

Платфоома

Выставка

Агент

Вакансии

EA

Отраслевой

Котировки

Показатель
Using Bollinger Bands in Crypto Trading
Нигерия | 2025-01-30 18:31#firstdealofthenewyearFateema
Bollinger Bands are a popular technical analysis tool used in crypto trading to identify potential price breakouts, overbought and oversold conditions, and market volatility. They consist of three lines:
1. Middle Band – A simple moving average (SMA), typically set to 20 periods.
2. Upper Band – Calculated as the SMA plus two standard deviations.
3. Lower Band – Calculated as the SMA minus two standard deviations.
How to Use Bollinger Bands in Crypto Trading
1. Identifying Overbought and Oversold Conditions
Price Near Upper Band → The asset may be overbought, signaling a potential pullback.
Price Near Lower Band → The asset may be oversold, indicating a possible bounce.
2. Bollinger Band Squeeze (Volatility Indicator)
Bands Contracting → Low volatility, possible upcoming breakout.
Bands Expanding → Increased volatility, confirming a trend continuation.
3. Breakout Trading Strategy
If the price breaks above the upper band with strong volume, it may signal a bullish breakout.
If the price breaks below the lower band with strong volume, it may indicate a bearish breakout.
4. Using Bollinger Bands with Other Indicators
RSI (Relative Strength Index): Confirms overbought/oversold conditions.
MACD (Moving Average Convergence Divergence): Helps validate breakout signals.
Support & Resistance Levels: Avoid false breakouts by checking key price levels.
Limitations
False signals can occur, so always combine Bollinger Bands with other indicators.
Does not predict trend direction, only volatility changes.
Would you like insights on applying Bollinger Bands in specific market conditions or assets?
Нравится 0
Я тоже хочу высказать замечания.
Задать вопрос
0Комментарии

Пока нет комментариев, оставьте комментарий первым
Задать вопрос
Пока нет комментариев, оставьте комментарий первым