
2025-09-25 02:14
Отраслевойgbpusd analysis
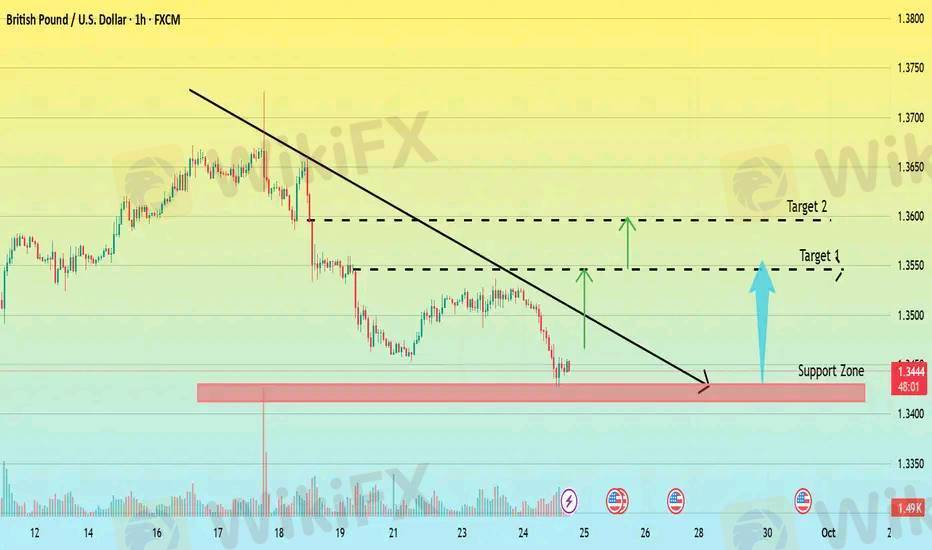
This GBP/USD 1-hour chart highlights a potential bullish reversal setup. The price is currently testing a significant support zone (marked in red) near 1.3440. A descending trendline shows recent bearish momentum, but the market may be preparing for a breakout.
If the support holds, we could see a bullish move toward Target 1 at 1.3547 and potentially Target 2 at 1.3596, as indicated by the upward arrows. A break above the trendline resistance would further confirm the bullish scenario.
Нравится 0

Ovifx
ट्रेडर
Популярные обсуждения
Технический показатель
Розыгрыш Xiaomi Redmi Note 9 и 20-и VIP-подписок
Технический показатель
ВЫСКАЗЫВАНИЯ БАЙДЕНА ДАВЯТ НА ВАЛЮТЫ РАЗВИВАЮЩИХСЯ СТРАН
Технический показатель
Европа заключила совместный контракт на поставку ремдесивира для лечения COVID-19...
Технический показатель
Индия: Решение Резерв. Банка Индии по проц. ставке, 4%, ожидалось 4%...
Анализ котировок
Китай: Индекс деловой актив. в сф. услуг Caixin PMI, Сентябрь, 54,8 п.
Технический показатель
События предстоящего дня: "АЛРОСА" опубликует результаты продаж за сентябрь...
Классификация рынка

Платфоома

Выставка

Агент

Вакансии

EA

Отраслевой

Котировки

Показатель
gbpusd analysis
Бенгалия | 2025-09-25 02:14This GBP/USD 1-hour chart highlights a potential bullish reversal setup. The price is currently testing a significant support zone (marked in red) near 1.3440. A descending trendline shows recent bearish momentum, but the market may be preparing for a breakout.
If the support holds, we could see a bullish move toward Target 1 at 1.3547 and potentially Target 2 at 1.3596, as indicated by the upward arrows. A break above the trendline resistance would further confirm the bullish scenario.
Нравится 0
Я тоже хочу высказать замечания.
Задать вопрос
0Комментарии

Пока нет комментариев, оставьте комментарий первым
Задать вопрос
Пока нет комментариев, оставьте комментарий первым