2020-05-06 09:34
ดัชนีทางเทคนิคS&P 500 PRICE CHART – SPX500 DAILY
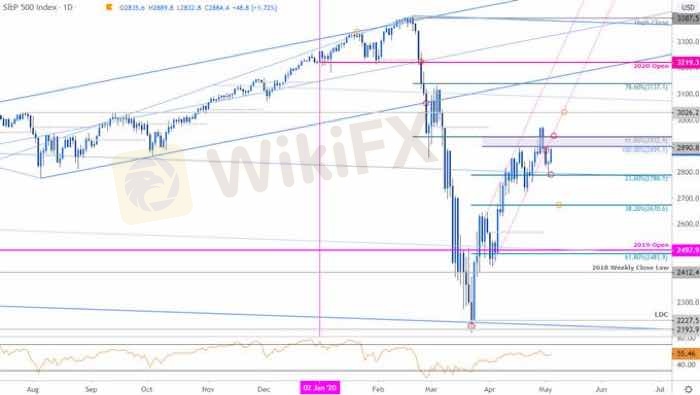
Technical Outlook: In my last S&P 500 Price Outlook we noted that the SPX rally had, “extended into a pivotal resistance barrier and the immediate focus is on a reaction up here with the bulls at risk sub-2930 near-term.” A false breakout on April 29th quickly reversed with the index pulling back into the 23.6% retracement of the mid-March rally at 2786 before rebounding.
The recovery is now once again approaching critical resistance at 2890-2932 – a region defined by May open, 100% extension of the advance off the yearly low and the 61.8% retracement of the 2020 range. A breach / close above this threshold is still needed to unleash the next leg higher in SPX towards the August 2019 highs at 3026. A break below Fibonacci support would risk a larger price correction with subsequent objectives at 2670.
ถูกใจ 0

TPKNX
Mga kalahok
การพูดคุยยอดนิยม
ดัชนีทางเทคนิค
สอบถามค่ะ
ดัชนีทางเทคนิค
ผูกบัญชี
ดัชนีทางเทคนิค
vps พึ่งใช้มาได้ 7 วัน
ดัชนีทางเทคนิค
ประกาศรายชื่อผู้โชคดี แจกหนังสือ Forex
ดัชนีทางเทคนิค
vps 7 วันแล้วถูกตัด
ดัชนีทางเทคนิค
ขอคำแนะนำหน่อยครับ
การแบ่งแยกตลาด

แพลตฟอร์ม

งานแสดงสินค้า

ตัวแทนโบรกเกอร์

รับสมัครงาน

EA

อุตสาหกรรม

ราคาตลาด

ดัชนี


ถามคำถาม
ยังไม่มีใครแสดงความคิดเห็น รีบแสดงความคิดเห็นก่อนเพื่อน