2025-01-29 17:09
อุตสาหกรรมIntroduction to Stochastic Oscillators in Forex
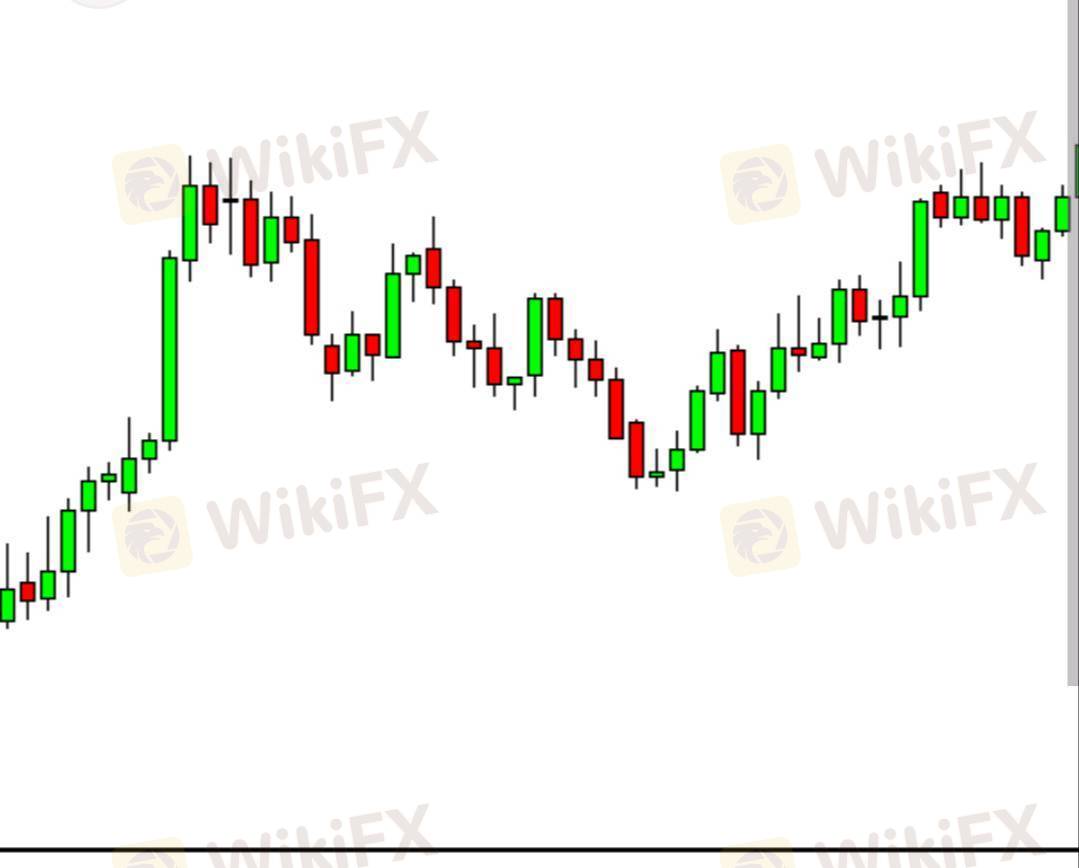
A Stochastic Oscillator in Forex is a momentum indicator used to identify potential trend reversals by comparing a currency pair's closing price to its recent price range over a specified period, typically indicating overbought or oversold conditions when the reading falls above 80 or below 20 respectively, helping traders anticipate potential price corrections; it is represented by two lines, %K (fast line) and %D (slow line), with buy signals often occurring when the %K line crosses above the %D line from below and sell signals when it crosses below the %D line from above.
ถูกใจ 0
FX2489435150
โบรกเกอร์
การพูดคุยยอดนิยม
ดัชนีทางเทคนิค
สอบถามค่ะ
ดัชนีทางเทคนิค
ผูกบัญชี
ดัชนีทางเทคนิค
vps พึ่งใช้มาได้ 7 วัน
ดัชนีทางเทคนิค
ประกาศรายชื่อผู้โชคดี แจกหนังสือ Forex
ดัชนีทางเทคนิค
vps 7 วันแล้วถูกตัด
ดัชนีทางเทคนิค
ขอคำแนะนำหน่อยครับ
การแบ่งแยกตลาด

แพลตฟอร์ม

งานแสดงสินค้า

ตัวแทนโบรกเกอร์

รับสมัครงาน

EA

อุตสาหกรรม

ราคาตลาด

ดัชนี
Introduction to Stochastic Oscillators in Forex
 ประเทศไนจีเรีย | 2025-01-29 17:09
A Stochastic Oscillator in Forex is a momentum indicator used to identify potential trend reversals by comparing a currency pair's closing price to its recent price range over a specified period, typically indicating overbought or oversold conditions when the reading falls above 80 or below 20 respectively, helping traders anticipate potential price corrections; it is represented by two lines, %K (fast line) and %D (slow line), with buy signals often occurring when the %K line crosses above the %D line from below and sell signals when it crosses below the %D line from above.
ถูกใจ 0
ฉันต้องการที่จะแสดงความคิดเห็น
ถามคำถาม
0ความคิดเห็น

ยังไม่มีใครแสดงความคิดเห็น รีบแสดงความคิดเห็นก่อนเพื่อน

ถามคำถาม
ยังไม่มีใครแสดงความคิดเห็น รีบแสดงความคิดเห็นก่อนเพื่อน