2020-05-06 09:41
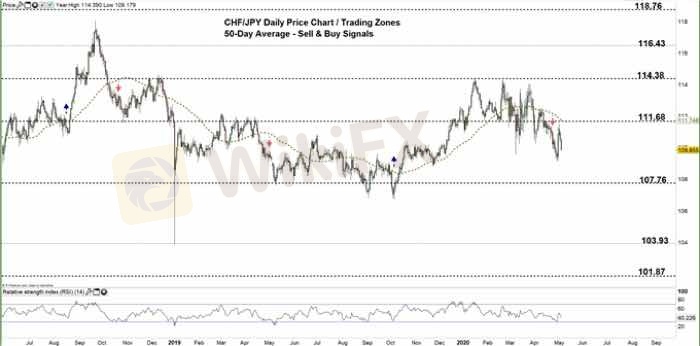
Chỉ số kỹ thuậtCHF/JPY DAILY PRICE CHART (JULY 1, 2018 – MAY 5, 2
CHFJPY daily price chart zoomed in 05-05-20.
Based on analysis of the daily chart, on March 31 CHF/JPY broke below the uptrend line originated from the March 9 low at 109.58. Last month, the price failed on multiple occasions to overtake the 50-day moving average, indicating that bears were still in charge. On April 13, the pair fell and stuck in the current trading zone 10.7.76- 111.68.
A close below the low end of the zone could embolden bears to press towards 103.93. A further close below that level could send CHFJPY towards 101.87. In that’s scenario, the weekly support levels underscored on the chart (zoomed in) should be watched closely.
In turn, a close above the high end of the zone would mean a weaker bearish sentiment. This may trigger a rally towards 114.38. A further close above that level could extend this rally towards 116.43. Although, the weekly resistance levels printed on the chart would be worth monitoring.
Thích 0

TPKNX
Participants
Bình luận phổ biến
Ngành
Có cao quá k?
Ngành
Xin ý kiến liberforex
Ngành
Đầu tư CDG
Ngành
Cắt lỗ
Ngành
Có nên chốt lỗ?
Ngành
Hỏi về dòng tiền
Phân loại diễn đàn

Nền tảng

Triển lãm

IB

Tuyển dụng

EA

Ngành

Chỉ số thị trường

Chỉ số


Đặt câu hỏi
Chưa có người bình luận, hãy là người bình luận đầu tiên