
2020-05-06 09:46
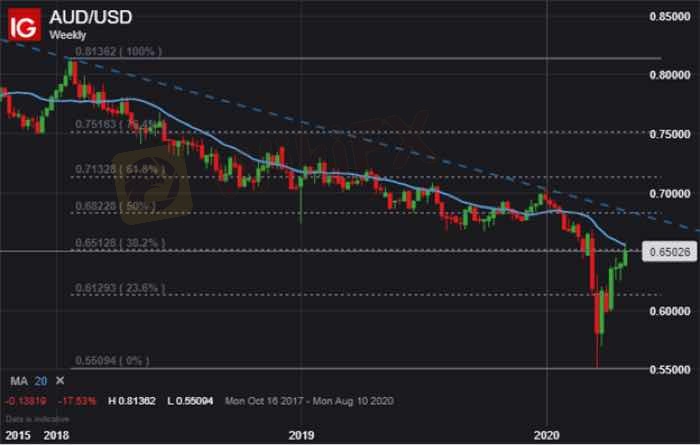
Chỉ số kỹ thuậtAUD/USD PRICE CHART: WEEKLY TIME FRAME (OCTOBER 20
The Australian Dollar faces a pivotal inflection point as AUD/USD price action rallies into a huge area of resistance. This technical barrier, which threatens to send AUD/USD recoiling back lower, is highlighted by a confluence of its 20-week moving average and 38.2% Fibonacci Retracement level of the January 2018 to March 2020 trading range.
Thích 0

TPKNX
المشاركين
Bình luận phổ biến
Ngành
Có cao quá k?
Ngành
Xin ý kiến liberforex
Ngành
Đầu tư CDG
Ngành
Cắt lỗ
Ngành
Có nên chốt lỗ?
Ngành
Hỏi về dòng tiền
Phân loại diễn đàn

Nền tảng

Triển lãm

IB

Tuyển dụng

EA

Ngành

Chỉ số thị trường

Chỉ số
AUD/USD PRICE CHART: WEEKLY TIME FRAME (OCTOBER 20
Hoa Kỳ | 2020-05-06 09:46Thích 0
Tôi cũng muốn bình luận.
Đặt câu hỏi
0bình luận

Chưa có người bình luận, hãy là người bình luận đầu tiên
Đặt câu hỏi
Chưa có người bình luận, hãy là người bình luận đầu tiên