
2021-04-02 09:43
行情分析Theta Price Prediction:
相关品种:
外汇,其他,其他,其他,其他,其他
行情分析:
Theta Price Prediction: THETA beginning a deep correction
CRYPTOS | 4/2/2021 12:27:39 AM GMT
Share on Twitter Share on Facebook Share on Linkedin
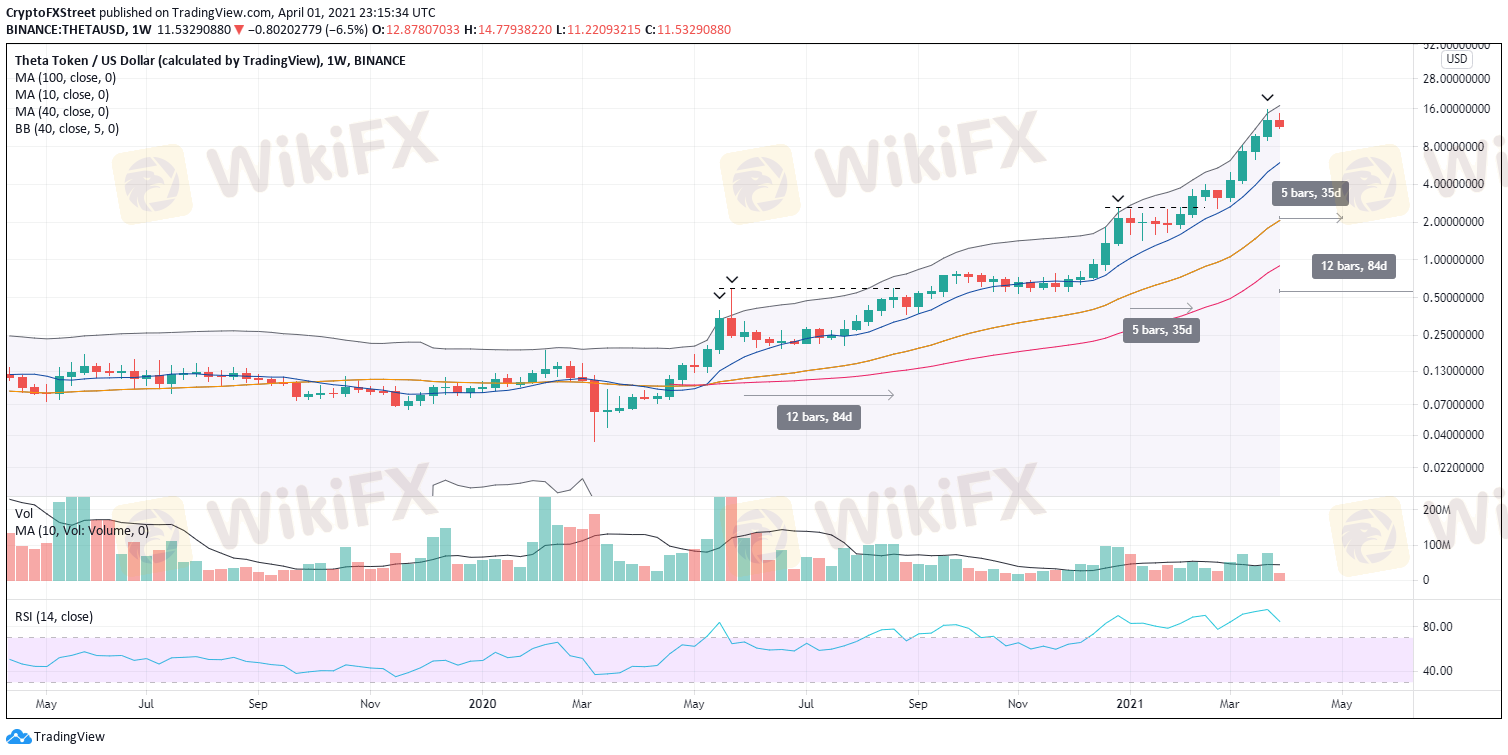
Theta price last reached five standard deviations above the mean last week.
Historical precedent projects a decline of at least 45%.
10-week simple moving average (SMA) has stabilized price declines in the past.
Theta price engineered a remarkable advance of 44,160% from the March 2020 low to the March high. What makes it even more impressive is that the price has found constant support at or around the 10-week SMA since April 2020. Additionally, THETA traded five standard deviations (StdDEV) above the mean (40-week SMA) in March, putting traders on alert that a correction was near.
Theta price climbed 290% in March
Measuring the distance from the price to a moving average is a valuable tool to identify periods of extreme deviation that the naked eye can’t always pick up. In the case of THETA, the digital token has exceeded five standard deviations from the 40-week SMA just four weeks since the March 2020 low, including last week.
In May 2020, THETA reached more than five standard deviations above the mean for two straight weeks. The other time this occurred was in December 2020. In May, the altcoin crashed 65% but did find support at the 10-week SMA. Later in December, THETA dropped almost 45% but bottomed above the 10-week SMA.
Based on the previous percentages and averaging out the two to equal 55%, THETA could fall to $7.06, basically a decline of 40% from price at the time of writing. A test of the 10-week SMA would be an almost 50% decline from the current price and 60% from the March high.
赞 0

Rey
交易者
热门讨论
业内
哎,现在明白不赌就是赢啊
行情分析
美元/加元技术面
技术指标
外汇技术分析之波浪理论
业内
[活動]論交易,贏取200元話費補貼
技术指标
EZ.Fury Kite是基于趋势指标MA进行判断
技术指标
指标派是什么?
集市分类

平台

展会

IB

招聘

EA

业内

行情

指标
Theta Price Prediction:
菲律宾 | 2021-04-02 09:43Theta Price Prediction: THETA beginning a deep correction
CRYPTOS | 4/2/2021 12:27:39 AM GMT
Share on Twitter Share on Facebook Share on Linkedin
Theta price last reached five standard deviations above the mean last week.
Historical precedent projects a decline of at least 45%.
10-week simple moving average (SMA) has stabilized price declines in the past.
Theta price engineered a remarkable advance of 44,160% from the March 2020 low to the March high. What makes it even more impressive is that the price has found constant support at or around the 10-week SMA since April 2020. Additionally, THETA traded five standard deviations (StdDEV) above the mean (40-week SMA) in March, putting traders on alert that a correction was near.
Theta price climbed 290% in March
Measuring the distance from the price to a moving average is a valuable tool to identify periods of extreme deviation that the naked eye can’t always pick up. In the case of THETA, the digital token has exceeded five standard deviations from the 40-week SMA just four weeks since the March 2020 low, including last week.
In May 2020, THETA reached more than five standard deviations above the mean for two straight weeks. The other time this occurred was in December 2020. In May, the altcoin crashed 65% but did find support at the 10-week SMA. Later in December, THETA dropped almost 45% but bottomed above the 10-week SMA.
Based on the previous percentages and averaging out the two to equal 55%, THETA could fall to $7.06, basically a decline of 40% from price at the time of writing. A test of the 10-week SMA would be an almost 50% decline from the current price and 60% from the March high.
外汇
其他
其他
其他
其他
其他
赞 0
我也要评论
提问
0条评论

还没人评论,赶紧抢占沙发
提问
还没人评论,赶紧抢占沙发