TECHNICAL ANALYSIS
摘要:Get key insights on current market trends in forex, commodities, indices and other instruments to keep you inf
Get key insights on current market trends in forex, commodities, indices and other instruments to keep you informed of your trading strategy.
EUR/USD Intraday Bullish
Pivot point:1.1397
Resistance level 1: 1.1460 Resistance level 2: 1.1510 Resistance level 3: 1.1573
Support level 1: 1.1348 Support level 2: 1.1284 Support level 3: 1.1235
Comment: The EUR/USD continues its bullish trend by soaring in the last trading session. It broke all the resistance levels and succeed to remain above all of it. For further trading, a break below support level of 1.1348 might lead to 1.1284 area. However, breaking above resistance level of 1.1460 could push the pair higher to 1.1510 level.
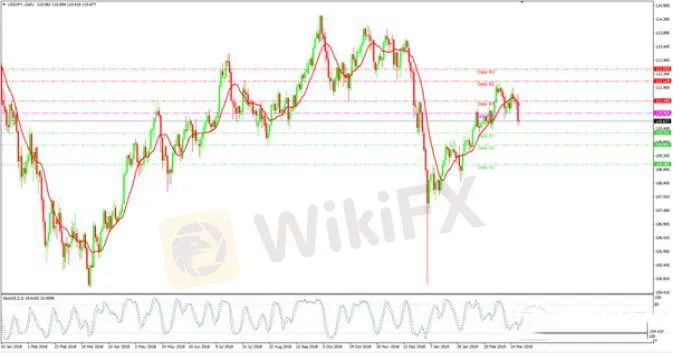
USD/JPY Intraday Bearish
Pivot point:110.96
Resistance level 1: 111.40 Resistance level 2: 112.11 Resistance level 3: 112.55
Support level 1: 110.24 Support level 2: 109.80 Support level 3: 109.08
Comment: The USD/JPY is showing a bearish trend after tumbling yesterday. After the market opened, the pair broke below all the support levels. Breaking below support level of 110.24 might lead to 109.80 area. However, breaking above resistance level of 111.40 could push the pair higher to 112.11 level.

GBP/USD Intraday Bearish
Pivot point:1.3204
Resistance level 1: 1.3264 Resistance level 2: 1.3333 Resistance level 3: 1.3393
Support level 1: 1.3136 Support level 2: 1.3076 Support level 3: 1.3007
Comment: The GBP/USD pair indicates a downside signal as it plunged in the last trading session. After the market open, the pair broke below the first and second support level. A break below support level of 1.3136 could extend further to 1.3076 area. Alternatively, breaking above 1.3264 could drive the prices up to 1.3333 level.

AUD/USD Intraday Bullish
Pivot point:0.7105
Resistance level 1: 0.7156 Resistance level 2: 0.7198 Resistance level 3: 0.7249
Support level 1: 0.7063 Support level 2: 0.7012 Support level 3: 0.6970
Comment: The AUD/USD is now showing a bullish trend as it traded within higher range in the last trading session. After the market opened, the pair broke all the resistance levels but bounced back and closed slightly higher. A break above resistance level of 0.7156 may lead the prices further to 0.7198 area while breaking below support level of 0.7063 may follow an extension of 0.7012 level.

NZD/USD Intraday Bullish
Pivot point:0.6874
Resistance level 1: 0.6922 Resistance level 2: 0.6964 Resistance level 3: 0.7012
Support level 1: 0.6832 Support level 2: 0.6784 Support level 3: 0.6743
Comment: The NZD/USD continues its bullish trend as it closed higher in the last trading session. The pair traded within a higher range and broke above some resistance levels. Breaking above resistance level of 0.6922 could push the prices up to 0.6964 area. Alternatively, a break below its first support level of 0.6832 may extend further to 0.6784 area.

USD/CHF Intraday Bearish
Pivot point:0.9942
Resistance level 1: 0.9991 Resistance level 2: 1.0058 Resistance level 3: 1.0107
Support level 1: 0.9875 Support level 2: 0.9826 Support level 3: 0.9760
Comment: The USD/CFH pair continues its bearish trend as it plummeted in the last trading session. It broke below all supporting levels and remained below them yesterday. Breaking above resistance level of 0.9991 could push the prices up to 1.0058 area. Alternatively, a break below its first support level of 0.9875 may extend further to 0.9826 area, which will strength the bearish trend.

USD/CAD Intraday Bearish
Pivot point:1.3301
Resistance level 1: 1.3347 Resistance level 2: 1.3391 Resistance level 3: 1.3437
Support level 1: 1.3257 Support level 2: 1.3212 Support level 3: 1.3168
Comment: The USD/CAD is still showing a downward outlook as it traded within a lower range in the last trading session. After the market opened, it broke the first support level, but bounced back afterwards. For further trading, a break above of 1.3347 would extend to 1.3391 which might stop the bearish trend. Alternatively, a break below of 1.3257 could extend to 1.3212.

Dow Jones Futures (CME) (Z18) Intraday Bullish
Pivot point:25755.4
Resistance level 1: 25847.6 Resistance level 2: 26027.3 Resistance level 3: 26119.5
Support level 1: 25575.7 Support level 2: 25483.5 Support level 3: 25303.8
Comment: The Dow jones index is indicating a bullish trend overall. A break below support level of 25575 might put the index in neutral territory and drive the prices down to 25483 area. Alternatively, breaking above support level of 25847 could help the bullish trend continue and lead the prices up to 26027 level.

Gold Spot Intraday Bullish
Pivot point:1309.29
Resistance level 1: 1320.03 Resistance level 2: 1327.59 Resistance level 3: 1338.33
Support level 1: 1301.73 Support level 2: 1290.99 Support level 3: 1283.43
Comment: The precious metal still shows a bullish trend as it closed higher the last few trading sessions consecutively. There are possibilities of breaking above resistance level of 1320 and extend further to 1327 area. However, a break below support level of 1301 might push the prices lower to 1291 level.
Crude Oil Intraday Bullish
Pivot point:59.62
Resistance level 1: 60.66 Resistance level 2: 61.32 Resistance level 3: 62.35
Support level 1: 58.96 Support level 2: 57.93 Support level 3: 57.26
Comment: The US oil price climbed yesterday to settle at its highest level in four months. It is looking to break todays resistance level of 60.66 and extend further to 61.32 area. On the other hand, a fall below support level of 58.96 might follow an extension of 57.93 level.
Disclaimer
These analyses are for information purposes only. They do not post a buy or sell recommendation for any of the financial instruments herein analyzed. The information is obtained from generally accessible data sources. TS capital assumes no responsibility for errors, inaccuracies or omissions in these materials, nor shall it be liable for damages arising out of any person's reliance upon the information on this page. TS capital shall not be liable for any special, indirect, incidental, or consequential damages, including without limitation, losses or unrealized gains that may result. Any information is subject to change without prior notice.


天眼交易商
汇率计算

