2020-05-06 09:47
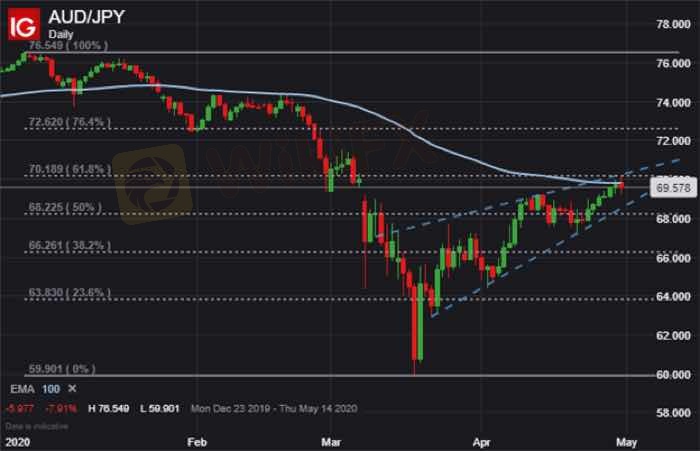
技术指标AUD/JPY PRICE CHART: DAILY TIME FRAME (DECEMBER 20
A daily AUD/JPY chart also reveals how the Australian Dollar could come under pressure after rejecting the 70.000 handle – a massive zone of confluent resistance noted by the 100-day exponential moving average, March 08 gap lower, 61.8% Fib, as well as the top barrier of its rising wedge pattern. Yet, AUD/JPY might keep marching higher, perhaps toward the 74.000 price mark, if trader risk appetite remains upbeat and volatility compression bolsters the currency carry trade.
赞 0

TPKNX
从业者
热门讨论
业内
哎,现在明白不赌就是赢啊
行情分析
美元/加元技术面
技术指标
外汇技术分析之波浪理论
业内
[活動]論交易,贏取200元話費補貼
技术指标
EZ.Fury Kite是基于趋势指标MA进行判断
技术指标
指标派是什么?
集市分类

平台

展会

IB

招聘

EA

业内

行情

指标


提问
还没人评论,赶紧抢占沙发