
2025-01-29 02:16
业内Candlestick trading
#firstdealofthenewyearchewbacca#
Candlestick trading is a popular method of analyzing and predicting market price movements in financial markets such as stocks, forex, and cryptocurrencies. It uses candlestick charts, which visually represent price data over a specific time frame. Each candlestick provides four key pieces of information:
1. Open: The price at which the asset started trading during the time period.
2. High: The highest price reached during the time period.
3. Low: The lowest price reached during the time period.
4. Close: The price at which the asset ended trading during the time period.
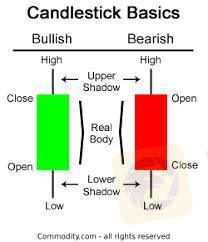
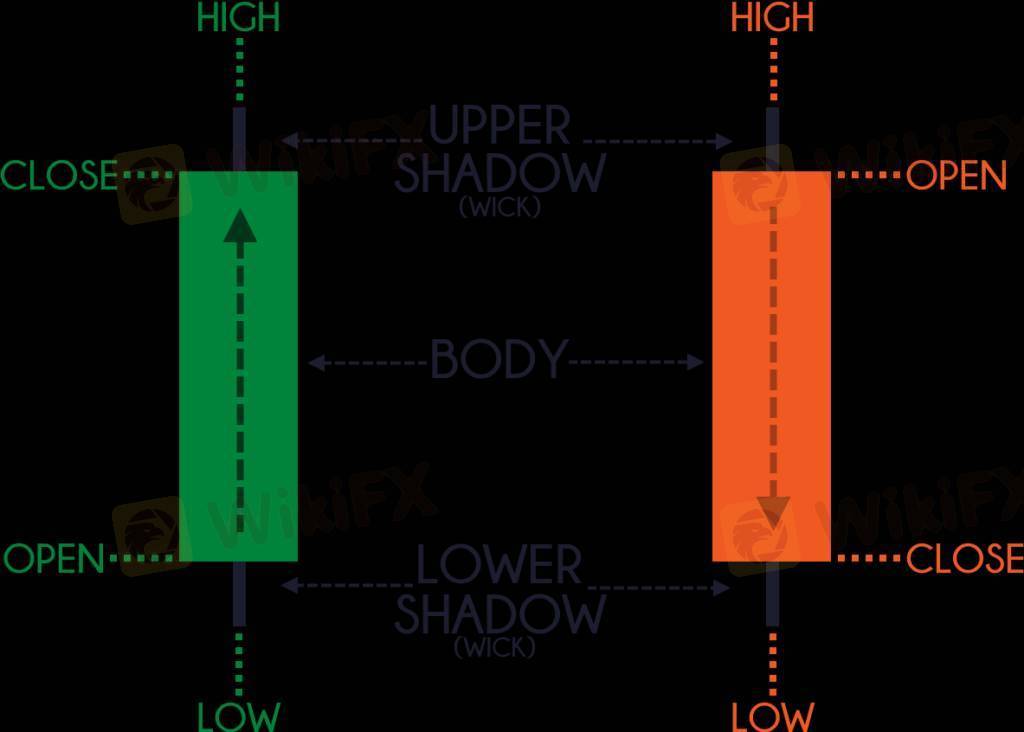
Components of a Candlestick
Body: The rectangular part of the candlestick represents the difference between the opening and closing prices.
Bullish Candle: If the closing price is higher than the opening price, the candle is typically green or white.
Bearish Candle: If the closing price is lower than the opening price, the candle is typically red or black.
Wicks/Shadows: The thin lines above and below the body show the high and low prices during the time period.
Common Candlestick Patterns
Candlestick patterns are categorized into reversal patterns and continuation patterns. Here are a few examples:
Reversal Patterns
1. Hammer: A small body near the top with a long lower wick, signaling potential bullish reversal.
2. Shooting Star: A small body near the bottom with a long upper wick, signaling potential bearish reversal.
3. Engulfing Pattern:
Bullish Engulfing: A small red candle followed by a larger green candle that "engulfs" the previous one.
Bearish Engulfing: A small green candle followed by a larger red candle that "engulfs" the previous one.
Continuation Patterns
1. Doji: A candle where the open and close prices are nearly the same, indicating indecision in the market.
2. Morning Star: A three-candle pattern signaling a bullish continuation.
3. Evening Star: A three-candle pattern signaling a bearish continuation.
Advantages of Candlestick Trading
Easy to read and interpret visually.
Provides insights into market sentiment.
Works well with other technical indicators (e.g., moving averages, RSI).
Limitations
Requires practice to interpret correctly.
Patterns may not always predict price movement accurately.
Works best when combined with other tools and analysis methods.
赞 0

FX1816125491
交易者
热门讨论
业内
哎,现在明白不赌就是赢啊
行情分析
美元/加元技术面
技术指标
外汇技术分析之波浪理论
业内
[活動]論交易,贏取200元話費補貼
技术指标
EZ.Fury Kite是基于趋势指标MA进行判断
技术指标
指标派是什么?
集市分类

平台

展会

IB

招聘

EA

业内

行情

指标
Candlestick trading
尼日利亚 | 2025-01-29 02:16#firstdealofthenewyearchewbacca#
Candlestick trading is a popular method of analyzing and predicting market price movements in financial markets such as stocks, forex, and cryptocurrencies. It uses candlestick charts, which visually represent price data over a specific time frame. Each candlestick provides four key pieces of information:
1. Open: The price at which the asset started trading during the time period.
2. High: The highest price reached during the time period.
3. Low: The lowest price reached during the time period.
4. Close: The price at which the asset ended trading during the time period.
Components of a Candlestick
Body: The rectangular part of the candlestick represents the difference between the opening and closing prices.
Bullish Candle: If the closing price is higher than the opening price, the candle is typically green or white.
Bearish Candle: If the closing price is lower than the opening price, the candle is typically red or black.
Wicks/Shadows: The thin lines above and below the body show the high and low prices during the time period.
Common Candlestick Patterns
Candlestick patterns are categorized into reversal patterns and continuation patterns. Here are a few examples:
Reversal Patterns
1. Hammer: A small body near the top with a long lower wick, signaling potential bullish reversal.
2. Shooting Star: A small body near the bottom with a long upper wick, signaling potential bearish reversal.
3. Engulfing Pattern:
Bullish Engulfing: A small red candle followed by a larger green candle that "engulfs" the previous one.
Bearish Engulfing: A small green candle followed by a larger red candle that "engulfs" the previous one.
Continuation Patterns
1. Doji: A candle where the open and close prices are nearly the same, indicating indecision in the market.
2. Morning Star: A three-candle pattern signaling a bullish continuation.
3. Evening Star: A three-candle pattern signaling a bearish continuation.
Advantages of Candlestick Trading
Easy to read and interpret visually.
Provides insights into market sentiment.
Works well with other technical indicators (e.g., moving averages, RSI).
Limitations
Requires practice to interpret correctly.
Patterns may not always predict price movement accurately.
Works best when combined with other tools and analysis methods.
赞 0
我也要评论
提问
0条评论

还没人评论,赶紧抢占沙发
提问
还没人评论,赶紧抢占沙发