
2025-01-29 15:15
业内Technical Vs fundamental analysis in forex.
#firstdealofthenewyearAKEEL
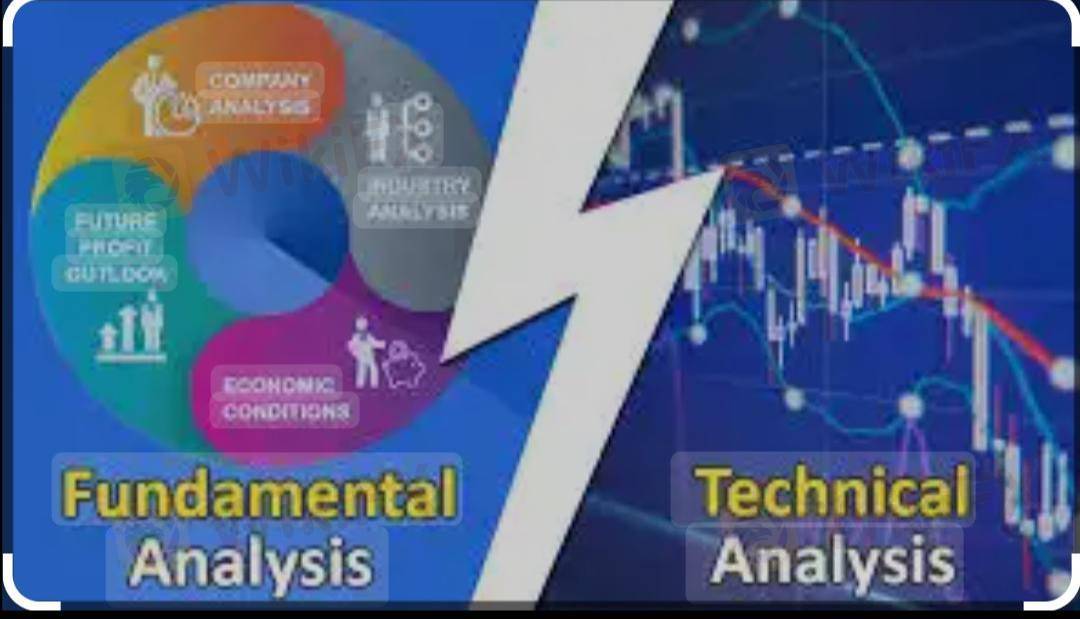
Forex traders use technical and fundamental analysis to make trading decisions. Both approaches have unique advantages and can be combined for a stronger strategy.
1. Technical Analysis (TA)
Definition:
Technical analysis focuses on price action, historical data, and chart patterns to predict future price movements.
Key Technical Tools
Charts & Candlestick Patterns: Identify market sentiment (e.g., Doji, Engulfing, Head & Shoulders).
Indicators:
Moving Averages (MA): Identifies trends.
Relative Strength Index (RSI): Measures overbought/oversold levels.
MACD (Moving Average Convergence Divergence): Confirms trends.
Bollinger Bands: Shows volatility.
Support & Resistance Levels: Key price zones where reversals or breakouts may happen.
Trend Lines & Fibonacci Retracement: Helps identify potential reversal points.
Pros of Technical Analysis
✔ Works well for short-term trading.
✔ Easy to apply with trading software.
✔ Helps in identifying precise entry & exit points.
Cons of Technical Analysis
✘ May not account for major economic events.
✘ False signals in choppy markets.
2. Fundamental Analysis (FA)
Definition:
Fundamental analysis focuses on economic, political, and financial factors that affect currency value.
Key Fundamental Factors
Interest Rates: Higher rates attract investors (e.g., USD strengthens if the Fed hikes rates).
Economic Data:
GDP growth (higher GDP = stronger currency).
Inflation reports (CPI, PPI).
Employment data (NFP in the U.S.).
Central Bank Policies: Federal Reserve (USD), ECB (EUR), BoJ (
#firstdealofthenewyearAKEEL
赞 0

belloyauyahayya
交易者
热门讨论
业内
哎,现在明白不赌就是赢啊
行情分析
美元/加元技术面
技术指标
外汇技术分析之波浪理论
业内
[活動]論交易,贏取200元話費補貼
技术指标
EZ.Fury Kite是基于趋势指标MA进行判断
技术指标
指标派是什么?
集市分类

平台

展会

IB

招聘

EA

业内

行情

指标
Technical Vs fundamental analysis in forex.
香港 | 2025-01-29 15:15#firstdealofthenewyearAKEEL
Forex traders use technical and fundamental analysis to make trading decisions. Both approaches have unique advantages and can be combined for a stronger strategy.
1. Technical Analysis (TA)
Definition:
Technical analysis focuses on price action, historical data, and chart patterns to predict future price movements.
Key Technical Tools
Charts & Candlestick Patterns: Identify market sentiment (e.g., Doji, Engulfing, Head & Shoulders).
Indicators:
Moving Averages (MA): Identifies trends.
Relative Strength Index (RSI): Measures overbought/oversold levels.
MACD (Moving Average Convergence Divergence): Confirms trends.
Bollinger Bands: Shows volatility.
Support & Resistance Levels: Key price zones where reversals or breakouts may happen.
Trend Lines & Fibonacci Retracement: Helps identify potential reversal points.
Pros of Technical Analysis
✔ Works well for short-term trading.
✔ Easy to apply with trading software.
✔ Helps in identifying precise entry & exit points.
Cons of Technical Analysis
✘ May not account for major economic events.
✘ False signals in choppy markets.
2. Fundamental Analysis (FA)
Definition:
Fundamental analysis focuses on economic, political, and financial factors that affect currency value.
Key Fundamental Factors
Interest Rates: Higher rates attract investors (e.g., USD strengthens if the Fed hikes rates).
Economic Data:
GDP growth (higher GDP = stronger currency).
Inflation reports (CPI, PPI).
Employment data (NFP in the U.S.).
Central Bank Policies: Federal Reserve (USD), ECB (EUR), BoJ (
#firstdealofthenewyearAKEEL
赞 0
我也要评论
提问
0条评论

还没人评论,赶紧抢占沙发
提问
还没人评论,赶紧抢占沙发