
2025-01-29 20:09
业内#ForexRiskTips
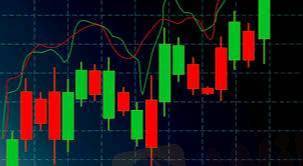
Using charts and indicators to plan trades helps traders make informed decisions by analyzing price movements, trends, and potential entry or exit points. Charts provide a visual representation of market behavior, allowing traders to identify patterns such as support and resistance levels, trendlines, and candlestick formations. Indicators like moving averages, RSI, MACD, and Fibonacci retracements help confirm trends, momentum, and potential reversals
赞 0

FX2606123886
ट्रेडर
热门讨论
业内
哎,现在明白不赌就是赢啊
行情分析
美元/加元技术面
技术指标
外汇技术分析之波浪理论
业内
[活動]論交易,贏取200元話費補貼
技术指标
EZ.Fury Kite是基于趋势指标MA进行判断
技术指标
指标派是什么?
集市分类

平台

展会

IB

招聘

EA

业内

行情

指标
#ForexRiskTips
肯尼亚 | 2025-01-29 20:09Using charts and indicators to plan trades helps traders make informed decisions by analyzing price movements, trends, and potential entry or exit points. Charts provide a visual representation of market behavior, allowing traders to identify patterns such as support and resistance levels, trendlines, and candlestick formations. Indicators like moving averages, RSI, MACD, and Fibonacci retracements help confirm trends, momentum, and potential reversals
赞 0
我也要评论
提问
0条评论

还没人评论,赶紧抢占沙发
提问
还没人评论,赶紧抢占沙发