
2025-08-17 06:01
业内WHAT ARE THE USE OF THESE THREE IN FUNDAMENTALS?
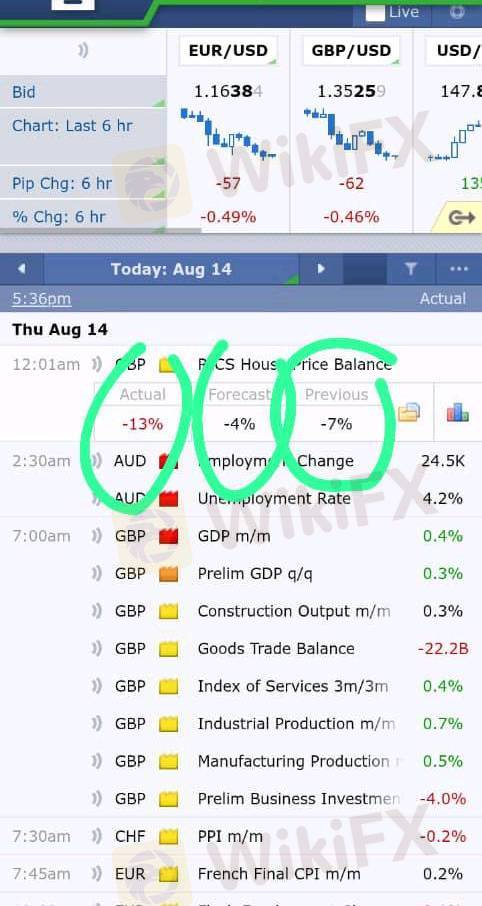
1. Previous
This is the last released data (from the previous period – last month, last quarter, or last report).
It serves as a reference point to compare whether the economy is improving or declining.
Example: If last month’s U.S. unemployment rate was 3.6%, that becomes the Previous.
2. Forecast
This is the expected figure, predicted by economists and analysts before the actual release.
It represents the market consensus (what traders are anticipating).
Price movements before the news often reflect traders’ positioning based on the forecast.
Example: For the current month, experts forecast unemployment to be 3.5%.
3. Actual
This is the real released data published at the news time.
It’s the most important value because it triggers volatility.
Traders compare Actual vs Forecast to determine market reaction.
🔑 How Traders Interpret It
If Actual > Forecast (in data that is good when higher, e.g., GDP, NFP, Retail Sales) → Currency often strengthens.
If Actual < Forecast → Currency often weakens.
If Actual = Forecast → Market may have little or no reaction, unless there’s a surprise detail in the report.
⚠️ Note: For some indicators like Unemployment Rate or Jobless Claims, lower values are better. So you flip the interpretation:
Lower than forecast = Positive for currency.
Higher than forecast = Negative for currency.
✅ Example: U.S. Non-Farm Payroll (NFP)
Previous: 209K
Forecast: 225K
Actual: 250K
👉 Since Actual (250K) > Forecast (225K) → USD usually strengthens because more jobs = stronger economy.
But if Actual < Forecast, USD would likely weaken.
🔎 In summary:
Previous = last report
Forecast = market expectation
Actual = real result → moves the market
#PathToAgentGrowthBreakthrough#SharingTradingMistakesAndGrowth#BrokerEvaluation##ExpertReview
赞 0

FX1530794864
交易者
热门讨论
业内
哎,现在明白不赌就是赢啊
行情分析
美元/加元技术面
技术指标
外汇技术分析之波浪理论
业内
[活動]論交易,贏取200元話費補貼
技术指标
EZ.Fury Kite是基于趋势指标MA进行判断
技术指标
指标派是什么?
集市分类

平台

展会

IB

招聘

EA

业内

行情

指标
WHAT ARE THE USE OF THESE THREE IN FUNDAMENTALS?
尼日利亚 | 2025-08-17 06:01
1. Previous
This is the last released data (from the previous period – last month, last quarter, or last report).
It serves as a reference point to compare whether the economy is improving or declining.
Example: If last month’s U.S. unemployment rate was 3.6%, that becomes the Previous.
2. Forecast
This is the expected figure, predicted by economists and analysts before the actual release.
It represents the market consensus (what traders are anticipating).
Price movements before the news often reflect traders’ positioning based on the forecast.
Example: For the current month, experts forecast unemployment to be 3.5%.
3. Actual
This is the real released data published at the news time.
It’s the most important value because it triggers volatility.
Traders compare Actual vs Forecast to determine market reaction.
🔑 How Traders Interpret It
If Actual > Forecast (in data that is good when higher, e.g., GDP, NFP, Retail Sales) → Currency often strengthens.
If Actual < Forecast → Currency often weakens.
If Actual = Forecast → Market may have little or no reaction, unless there’s a surprise detail in the report.
⚠️ Note: For some indicators like Unemployment Rate or Jobless Claims, lower values are better. So you flip the interpretation:
Lower than forecast = Positive for currency.
Higher than forecast = Negative for currency.
✅ Example: U.S. Non-Farm Payroll (NFP)
Previous: 209K
Forecast: 225K
Actual: 250K
👉 Since Actual (250K) > Forecast (225K) → USD usually strengthens because more jobs = stronger economy.
But if Actual < Forecast, USD would likely weaken.
🔎 In summary:
Previous = last report
Forecast = market expectation
Actual = real result → moves the market
#PathToAgentGrowthBreakthrough#SharingTradingMistakesAndGrowth#BrokerEvaluation##ExpertReview
赞 0
我也要评论
提问
0条评论

还没人评论,赶紧抢占沙发
提问
还没人评论,赶紧抢占沙发