
2025-10-27 16:00
业内IDENTITY KEY LEVEL
#NewbieGuide
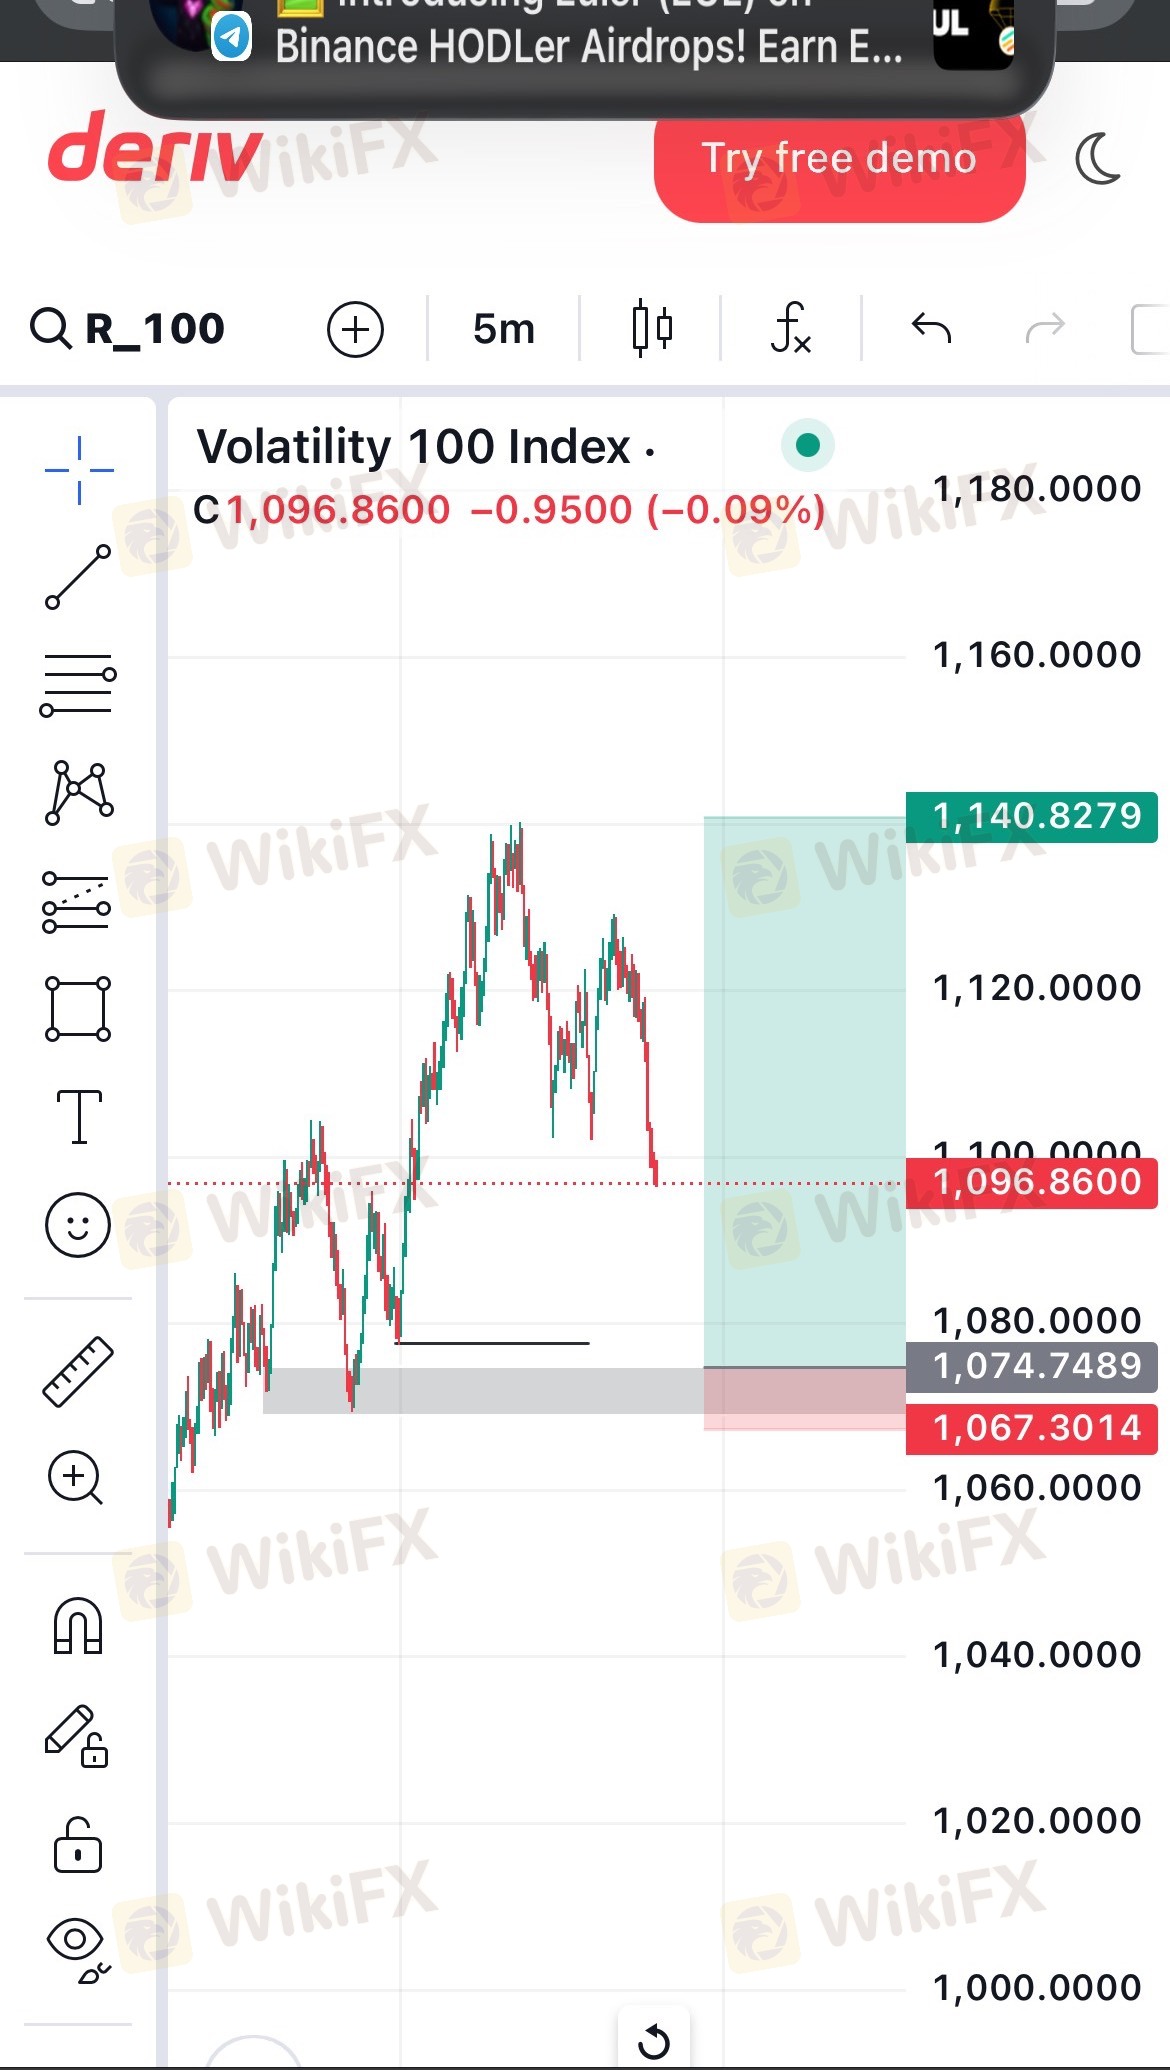
Start with understanding market structure. Learn how price moves in waves, forming trends (up, down, or sideways). Identify key areas like support (where price often stops falling) and resistance (where price often stops rising). These zones help you decide entry and exit points. Study candlestick patterns such as pin bars, engulfing candles, and dojis—they reveal how buyers and sellers are reacting at specific levels.
Next, learn how to read charts and indicators. Indicators like Moving Averages, RSI, MACD, and Bollinger Bands can guide you in spotting momentum, reversals, and overbought or oversold conditions. However, never rely solely on indicators—combine them with price action and confirmation signals.
赞 0

sartaz
交易者
热门讨论
业内
哎,现在明白不赌就是赢啊
行情分析
美元/加元技术面
业内
[活動]論交易,贏取200元話費補貼
技术指标
外汇技术分析之波浪理论
技术指标
EZ.Fury Kite是基于趋势指标MA进行判断
技术指标
指标派是什么?
集市分类

平台

展会

IB

招聘

EA

业内

行情

指标
IDENTITY KEY LEVEL
印度 | 2025-10-27 16:00#NewbieGuide
Start with understanding market structure. Learn how price moves in waves, forming trends (up, down, or sideways). Identify key areas like support (where price often stops falling) and resistance (where price often stops rising). These zones help you decide entry and exit points. Study candlestick patterns such as pin bars, engulfing candles, and dojis—they reveal how buyers and sellers are reacting at specific levels.
Next, learn how to read charts and indicators. Indicators like Moving Averages, RSI, MACD, and Bollinger Bands can guide you in spotting momentum, reversals, and overbought or oversold conditions. However, never rely solely on indicators—combine them with price action and confirmation signals.
赞 0
我也要评论
提问
0条评论

还没人评论,赶紧抢占沙发
提问
还没人评论,赶紧抢占沙发