2020-05-06 09:34
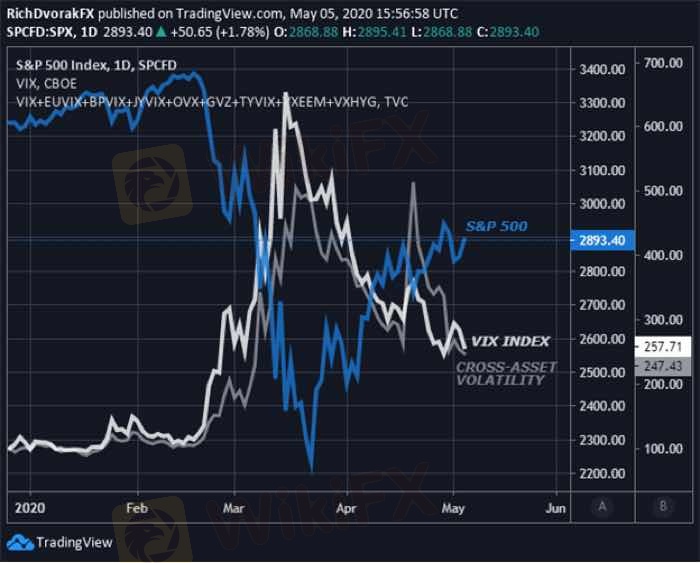
技術指標S&P 500 PRICE OUTLOOK BRIGHTENED AS VIX INDEX, CRO
Generally speaking, there is a strong inverse relationship observed among the direction of risk assets, like stocks, and level of market volatility. This is indicated by the negative correlation typically held between S&P 500 price action.
An influx of coronavirus optimism since mid-March, though supportive of the S&P 500, has largely kept the VIX Index and several cross-asset volatility benchmarks under pressure. The retracement lower in market volatility over recent weeks might seem encouraging on the surface, but VIX Index term structure indicates that investor uncertainty remains extremely high, and leaves the stock market rally in jeopardy, even as spot VIX falls.
贊 0

TPKNX
Profesional
熱門討論
業內
哎,现在明白不赌就是赢啊
行情分析
美元/加元技术面
技術指標
外汇技术分析之波浪理论
業內
[活動]論交易,贏取200元話費補貼
技術指標
EZ.Fury Kite是基于趋势指标MA进行判断
技術指標
指标派是什么?
市集分類

平臺

展會

代理商

招聘

EA

業內

行情

指標


提問
還沒人評論,趕緊搶佔沙發