2024-11-07 17:11
業內Types of Forex Charts: Line Chart v Bar Chart v Ca
Forex traders use charts to determine market direction and identify possible buying and selling opportunities. There are three types of charts commonly used in forex that you can flick between on MT4:
Line chart;
Bar chart;
Candlestick chart.
Line Chart:
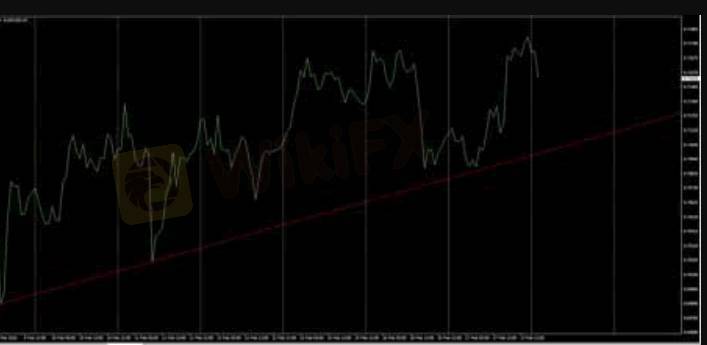
These charts are handy for quickly determining the trend – only the current/close price is graphed – as such these charts should not be used for placing stop loss or take profit orders.
Bar Chart:
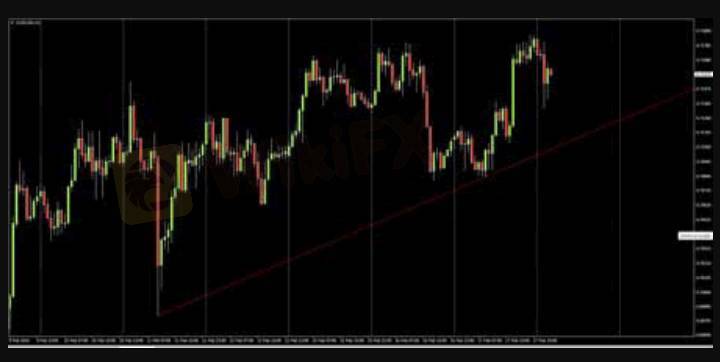
The chart is created with the use of bars where each bar has a high (top) and a low (bottom) with a line on either side; right side being the opening price and the left side being the closing price for the selected time period
Different colours can be used to identify bars that close higher than the open (bull or up bars) or lower than the open (bear or down bars). The example above has green lines for up bars and red bars for down bars. These charts show all the information you need but most traders and analysts tend to favour the third option – Candlestick charts.
Candlestick Chart:
This chart is created much like bar charts, with the only difference being that candlesticks add dimension and colour to the Bar Chart by depicting the area of the bar between the open and close as a two dimensional real body.
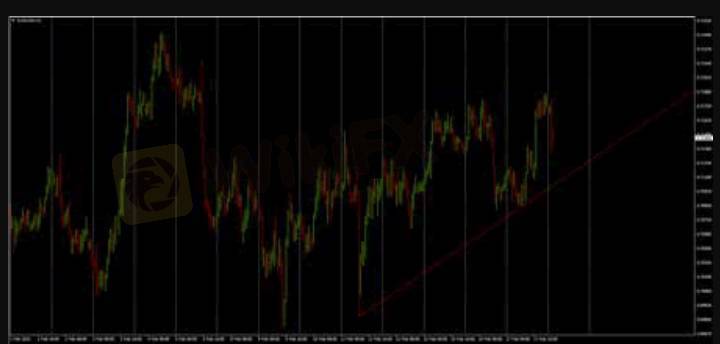
Candlesticks are comprised of a body which represents the difference between the open and close prices. An up candlestick occurs when the close is higher than the open – and down candlesticks occurs when the close is lower than the high. In the chart example above, up candlesticks are green whilst down candlesticks are red. If the open is equal to the close there will not be a body, just a line – this type of candle is referred to as a “Doji”.
The thinner lines extending beyond the body are called ‘Wicks’ – above the body is the high and below the body is the low for the selected time period. A large wick (relative to the body), indicates a potential turning point (support/resistance).
贊 0

张军17995
Trader
熱門討論
業內
哎,现在明白不赌就是赢啊
行情分析
美元/加元技术面
技術指標
外汇技术分析之波浪理论
業內
[活動]論交易,贏取200元話費補貼
技術指標
EZ.Fury Kite是基于趋势指标MA进行判断
技術指標
指标派是什么?
市集分類

平臺

展會

代理商

招聘

EA

業內

行情

指標
Types of Forex Charts: Line Chart v Bar Chart v Ca
 | 2024-11-07 17:11
Forex traders use charts to determine market direction and identify possible buying and selling opportunities. There are three types of charts commonly used in forex that you can flick between on MT4:
Line chart;
Bar chart;
Candlestick chart.
Line Chart:
These charts are handy for quickly determining the trend – only the current/close price is graphed – as such these charts should not be used for placing stop loss or take profit orders.
Bar Chart:
The chart is created with the use of bars where each bar has a high (top) and a low (bottom) with a line on either side; right side being the opening price and the left side being the closing price for the selected time period
Different colours can be used to identify bars that close higher than the open (bull or up bars) or lower than the open (bear or down bars). The example above has green lines for up bars and red bars for down bars. These charts show all the information you need but most traders and analysts tend to favour the third option – Candlestick charts.
Candlestick Chart:
This chart is created much like bar charts, with the only difference being that candlesticks add dimension and colour to the Bar Chart by depicting the area of the bar between the open and close as a two dimensional real body.
Candlesticks are comprised of a body which represents the difference between the open and close prices. An up candlestick occurs when the close is higher than the open – and down candlesticks occurs when the close is lower than the high. In the chart example above, up candlesticks are green whilst down candlesticks are red. If the open is equal to the close there will not be a body, just a line – this type of candle is referred to as a “Doji”.
The thinner lines extending beyond the body are called ‘Wicks’ – above the body is the high and below the body is the low for the selected time period. A large wick (relative to the body), indicates a potential turning point (support/resistance).
贊 0
我也要評論
提問
0條評論

還沒人評論,趕緊搶佔沙發


提問
還沒人評論,趕緊搶佔沙發