
2025-01-30 18:31
業內Using Bollinger Bands in Crypto Trading
#firstdealofthenewyearFateema
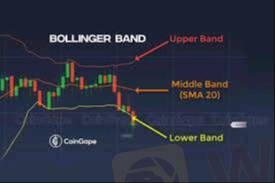
Bollinger Bands are a popular technical analysis tool used in crypto trading to identify potential price breakouts, overbought and oversold conditions, and market volatility. They consist of three lines:
1. Middle Band – A simple moving average (SMA), typically set to 20 periods.
2. Upper Band – Calculated as the SMA plus two standard deviations.
3. Lower Band – Calculated as the SMA minus two standard deviations.
How to Use Bollinger Bands in Crypto Trading
1. Identifying Overbought and Oversold Conditions
Price Near Upper Band → The asset may be overbought, signaling a potential pullback.
Price Near Lower Band → The asset may be oversold, indicating a possible bounce.
2. Bollinger Band Squeeze (Volatility Indicator)
Bands Contracting → Low volatility, possible upcoming breakout.
Bands Expanding → Increased volatility, confirming a trend continuation.
3. Breakout Trading Strategy
If the price breaks above the upper band with strong volume, it may signal a bullish breakout.
If the price breaks below the lower band with strong volume, it may indicate a bearish breakout.
4. Using Bollinger Bands with Other Indicators
RSI (Relative Strength Index): Confirms overbought/oversold conditions.
MACD (Moving Average Convergence Divergence): Helps validate breakout signals.
Support & Resistance Levels: Avoid false breakouts by checking key price levels.
Limitations
False signals can occur, so always combine Bollinger Bands with other indicators.
Does not predict trend direction, only volatility changes.
Would you like insights on applying Bollinger Bands in specific market conditions or assets?
贊 0

Estybest
交易者
熱門討論
業內
哎,现在明白不赌就是赢啊
行情分析
美元/加元技术面
技術指標
外汇技术分析之波浪理论
業內
[活動]論交易,贏取200元話費補貼
技術指標
EZ.Fury Kite是基于趋势指标MA进行判断
技術指標
指标派是什么?
市集分類

平臺

展會

代理商

招聘

EA

業內

行情

指標
Using Bollinger Bands in Crypto Trading
尼日利亞 | 2025-01-30 18:31#firstdealofthenewyearFateema
Bollinger Bands are a popular technical analysis tool used in crypto trading to identify potential price breakouts, overbought and oversold conditions, and market volatility. They consist of three lines:
1. Middle Band – A simple moving average (SMA), typically set to 20 periods.
2. Upper Band – Calculated as the SMA plus two standard deviations.
3. Lower Band – Calculated as the SMA minus two standard deviations.
How to Use Bollinger Bands in Crypto Trading
1. Identifying Overbought and Oversold Conditions
Price Near Upper Band → The asset may be overbought, signaling a potential pullback.
Price Near Lower Band → The asset may be oversold, indicating a possible bounce.
2. Bollinger Band Squeeze (Volatility Indicator)
Bands Contracting → Low volatility, possible upcoming breakout.
Bands Expanding → Increased volatility, confirming a trend continuation.
3. Breakout Trading Strategy
If the price breaks above the upper band with strong volume, it may signal a bullish breakout.
If the price breaks below the lower band with strong volume, it may indicate a bearish breakout.
4. Using Bollinger Bands with Other Indicators
RSI (Relative Strength Index): Confirms overbought/oversold conditions.
MACD (Moving Average Convergence Divergence): Helps validate breakout signals.
Support & Resistance Levels: Avoid false breakouts by checking key price levels.
Limitations
False signals can occur, so always combine Bollinger Bands with other indicators.
Does not predict trend direction, only volatility changes.
Would you like insights on applying Bollinger Bands in specific market conditions or assets?
贊 0
我也要評論
提問
0條評論

還沒人評論,趕緊搶佔沙發
提問
還沒人評論,趕緊搶佔沙發