
2025-08-12 21:15
業內After forming a double high at 3405.05/3408.71, th
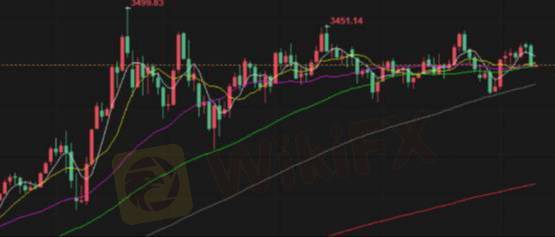
After forming a double high at 3405.05/3408.71, the price has been declining steadily. The middle Bollinger band at 3378.97 was effectively broken below, turning into resistance. The latest candlestick chart is trading close to the lower Bollinger band at 3346.97, with the band significantly wider than previously, indicating a trending downtrend rather than simple sideways fluctuations.#SharingTradingMistakesAndGrowth
贊 0

FX2074093105
Трейдер
熱門討論
業內
哎,现在明白不赌就是赢啊
行情分析
美元/加元技术面
技術指標
外汇技术分析之波浪理论
業內
[活動]論交易,贏取200元話費補貼
技術指標
EZ.Fury Kite是基于趋势指标MA进行判断
技術指標
指标派是什么?
市集分類

平臺

展會

代理商

招聘

EA

業內

行情

指標
After forming a double high at 3405.05/3408.71, th
新加坡 | 2025-08-12 21:15After forming a double high at 3405.05/3408.71, the price has been declining steadily. The middle Bollinger band at 3378.97 was effectively broken below, turning into resistance. The latest candlestick chart is trading close to the lower Bollinger band at 3346.97, with the band significantly wider than previously, indicating a trending downtrend rather than simple sideways fluctuations.#SharingTradingMistakesAndGrowth
贊 0
我也要評論
提問
0條評論

還沒人評論,趕緊搶佔沙發
提問
還沒人評論,趕緊搶佔沙發