Mohicans markets:Gold and Silver Rise Weakly The Gravity of Oil Prices Moves Down
Zusammenfassung:Spot gold was narrowly ranging during the pressure session on Thursday,August,18,continuing to be limited by the pivot point at 1766.24.Spot silver was lower below the pivot point at 19.87, with primary support at 19.43.

Key Data

Fundamentals Overview
Spot gold was narrowly ranging during the pressure session on Thursday,August,18,continuing to be limited by the pivot point at 1766.24.Spot silver was lower below the pivot point at 19.87, with primary support at 19.43.WTI crude oil was running not far above the pivot point at 87.44,with the first upside target at 89.28.The U.S. dollar index surged back higher,testing primary support at 106.73.
The Mohicans Markets strategy is for reference only and not as investment advice. Please read the terms of the statement at the end of the article carefully.The following strategy was updated at 16:30 on August 18, 2022, Beijing time.
Technical View
ONE · Technical Level · International Gold

1782 Long-short boundary and strong resistance
1773 Previous volume starting point, resistance level
1767/68 Asian and European resistance
1761/60 Asian and European support
1755 Wave key support
1750-45 Mid-term support
Technical Analysis
Yesterday,the U.S.retail sales data in July that is called Horrible Data was released broadly in line with expectations.However,the U.S.bond yields and subsequent meeting minutes did not give gold bulls the recession expectations they needed,and multiple pressures gave gold the upside.The only possible positive factor is the increase in positions from the previous decrease,but it remains to be seen if this can be sustained.The expectation of the market on gold is relatively unified,believing that there is resistance above and a short target below.There is no good support level near the current price,and we need to be alert to the possibility of a high downside.We should also note that gold is moving more technically at the moment.At present,the lower part is close to the early intensive trading position,more than empty in the 1755 position leaving a trace of contention,and this position can be regarded as the wave key support.
Note: The above strategy was updated at 16:00 on August 18th. This strategy is a day strategy, please pay attention to the release time of the strategy.
TWO ·Technical Level · Spot Silver

20.83 Mid-term resistance
20.4 Intraday strong resistance
20.24 Yesterday's decline starting point,the second resistance
20 off support becomes Asian and European resistance
19.68 Asian and European support
19.3 medium-term support
Technical Analysis
Silver basically followed gold's trend.It did not successfully stand on 19.8 in the early morning,then continued its downward movement and fell below 19.65-19.7 support.From the perspective of options changes,both long and short positions are showing signs of leaving the market,and the long and short stocks at key positions are comparable,and the standoff is obvious.Although there are equal long and short stocks in the 19.75-19.8 area,there are signs that the shorts continue to add to their bets,which is expected to pose resistance to silver.There are 499 lots of call options above 20 leaving the market and the upside momentum is weakened.If silver continues on the downside,attention needs to be paid to 19.5-19.68 support,where long and short forces are comparable and could be caught in a shakeout near this position.19.3-19.4 has short bets on silver to move further lower,with short targets at 19.25.
Note: The above strategy was updated at 16:00 on August 18th. This strategy is a day strategy, please pay attention to the release time of the strategy.
THREE · Technical Level · US Crude Oil

91 The bull reduces but the stock is large, the bearish unchanged, the bullish target is also a strong resistance
89-89.5 The bullish increase, the bearish decrease, the primary target of the rebound is also the second resistance
86.3-86 Second support
86 Intraday support
Technical Analysis
Crude oil continued to oscillate between the 86 support and 89 resistance mentioned in yesterday's report, and so on. Judging from the overall flow of option funds, the bears continued to bet down slightly, suggesting that the center of gravity of crude oil volatility has moved substantially lower than the previous period. Below the current price, 85, 83 and other early short target put options slightly increased positions, which are expected to be two support levels for short-term fluctuations respectively. And above the current price, 89 call options increased slightly, which is the first target for the rebound in the day.However, due to the departure of call options with prices such as 90 and 92 above, the momentum of the US market to break above 89 and go further higher is expected to be limited.
Note: The above strategy was updated at 16:00 on August 18th. This strategy is a day strategy, please pay attention to the release time of the strategy.
FOUR · Technical Level · EURUSD

1.03-1.0325 Bullish increase, bearish unchanged, long target zone, resistance zone
1.0250 Bullish increase, bearish decrease, long target
1.0225 Bullish increase, bearish increase, resistance
1.0175 Bullish unchanged, bearish increase, resistance
1.0150 Bullish increase, bearish unchanged, key support level
1.00 Bullish unchanged, bearish increase, bearish target
0.99 Bullish unchanged, bearish increase significantly, bearish target
Technical Analysis
On Wednesday, the euro against the dollar shuttled up and down between the key level of 1.0175 suggested yesterday, but did not stabilize. Judging from the new options changes, the situation of long and short competition continues to form between 1.0150-1.0175-1.0225. Before the breakthrough, Europe and the United States are likely to continue to oscillate in this range. If it can break through 1.0225 and stabilize, it may attract more upward momentum in the short term, bulls target 1.0250 while 1,03 is considered. The stock of put options will continue to act as upside resistance here. On the other hand, if it breaks below 1.0150, the short target will continue to look at 1.00, and although there are many put options at 0.99-1.00, it is expected to prepare for the market breakout, and the probability of short-term arrival is low.
Note: The above strategy was updated at 16:00 on August 18th. This strategy is a day strategy, please pay attention to the release time of the strategy.
FIVE · Technical Level · GBPUSD
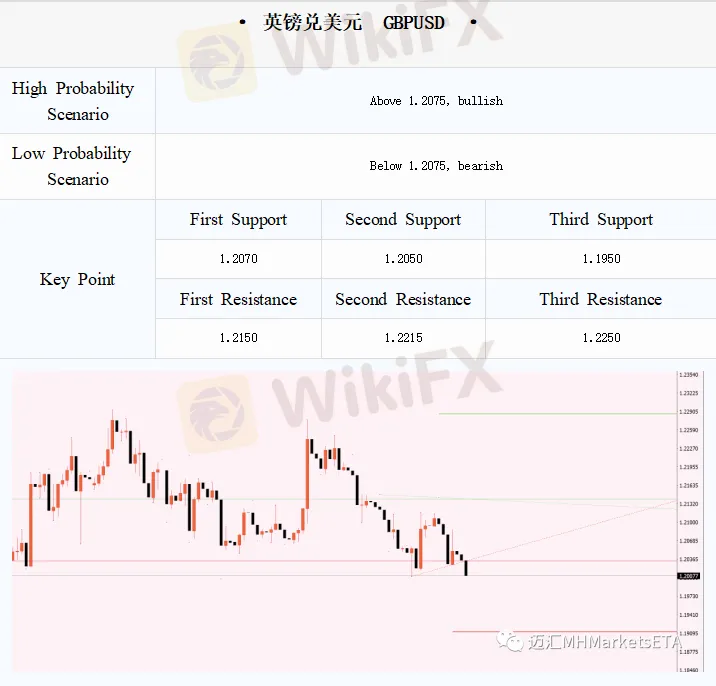
1.22 Bullish decrease, bearish unchanged, resistance level
1.2150-1.2170 Bullish increase sharply, bearish unchanged, bullish target area
1.2050 Bullish increase, bearish unchanged, bullish target
1.20 Bullish unchanged, bearish slightly reduced, support level
1.19 Bullish unchanged , bearish sharply reduced, support level
Technical Analysis
GBP/USD failed to strengthen on Wednesday, as indicated in yesterday's report, with the prospect of a hike in the BOE providing limited boost to GBPUS, which fell back after a short upward test and was in a choppy trade around 1.2050.
From the perspective of options changes, although the bullish bets did not increase below 1.2050, the put options were lightened at 1.20 and 1.19, indicating that the bearish sentiment did not heat up. Combined with the stock of options, it is expected that the 1.20-1.2020 range will still be supported. In the event of a breakdown, the focus will turn to 1.1950 and 1.19. However, considering that there is no sign of a significant increase in bearish sentiment, it is expected that the probability of short-term touch is limited. On the other hand, 1.2050, and 1.2150-1.2170 continue to have call options increase, indicating that some bulls still have not given up. If the pound and the United States can re-stand at 1.2050, you can pay attention to further upward momentum.
Note: The above strategy was updated at 16:00 on August 18th. This strategy is a day strategy, please pay attention to the release time of the strategy.
SIX · Technical Level · AUDUSD

0.705 Bullish decrease but stock is dominant, bearish unchanged, long target
0.7 Bullish decrease but stock is dominant, bearish increase, long target
0.695 Bullish unchanged, bearish slightly decreased, short-term resistance
0.69 Bullish decrease, bearish slightly decreased but stock is dominant, the previous short target is
0.68-0.685 Bullish increase, the bearish decrease greatly, the short target, the downward action can be weakened
Technical Analysis
The Australian dollar held steady around 0.692 today after falling below the key support of 0.7 yesterday. From the perspective of options changes, both long and short positions have clearly left the market, and there is a large loss of put options below the short target of 0.58-0.685. It is expected that the short-term decline of the Australian dollar may be difficult to reach a lower point. There are more short positions above 0.695, which constitutes resistance to the trend of the Australian dollar. If it is successfully broken, the long target is 0.7770.705. On the other hand, the short target is 0.69. Although there are still more short positions below, both 0.6850 and 0.68 have obvious signs of leaving the market, or it may be difficult to further increase the downward momentum of the Australian dollar.
Statement | Disclaimer
Disclaimer: The information contained in this material is for general advice only. It does not take into account your investment goals, financial situation or special needs. Mohicans Markets has made every effort to ensure the accuracy of the information as of the date of publication. Mohicans Markets makes no warranties or representations regarding this material. The examples in this material are for illustration only. To the extent permitted by law, Mohicans Markets and its employees shall not be liable for any loss or damage arising in any way, including negligence, from any information provided or omitted from this material.The features of Mohicans Markets products, including applicable fees and charges, are outlined in the product disclosure statements available on the Mohicans Markets website and should be considered before deciding to deal with these products. Derivatives can be risky and losses can exceed your initial payment. Mohicans Markets recommends that you seek independent advice.
Mohicans Markets, (Abbreviation: MHMarkets or MHM, Chinese name: Mai hui), Australian Financial Services License No. 001296777.


WikiFX-Broker
Aktuelle Nachrichten
Einsturz des Goldpreises: Der Gold-Boom wird weitergehen, sagen die Analysten von Goldman Sachs
 WikiFX
Hohe Aktienbewertungen und „ungeordnete Korrekturen könnten die Weltwirtschaft erschüttern, warnt der IWF
WikiFXSo teuer ist der Weg zum Milliarden-Unternehmen – laut neuer Studie
WikiFXWechselkursberechnung

