WIKIFX REPORT: Can USD/ZAR Go For A Higher High?
Zusammenfassung:Looking at the technical picture of USD/ZAR on our daily chart, we can see that after reversing higher at the end of March, the pair is now trading above a short-term upside support line taken from the low of April 13th. That said, the rate is currently trading below a key resistance area between the 16.1848 and 16.3195 levels, marked by the highs of June 13th and May 16th respectively. In order to aim further north, we would prefer to wait for a push above that resistance area first.
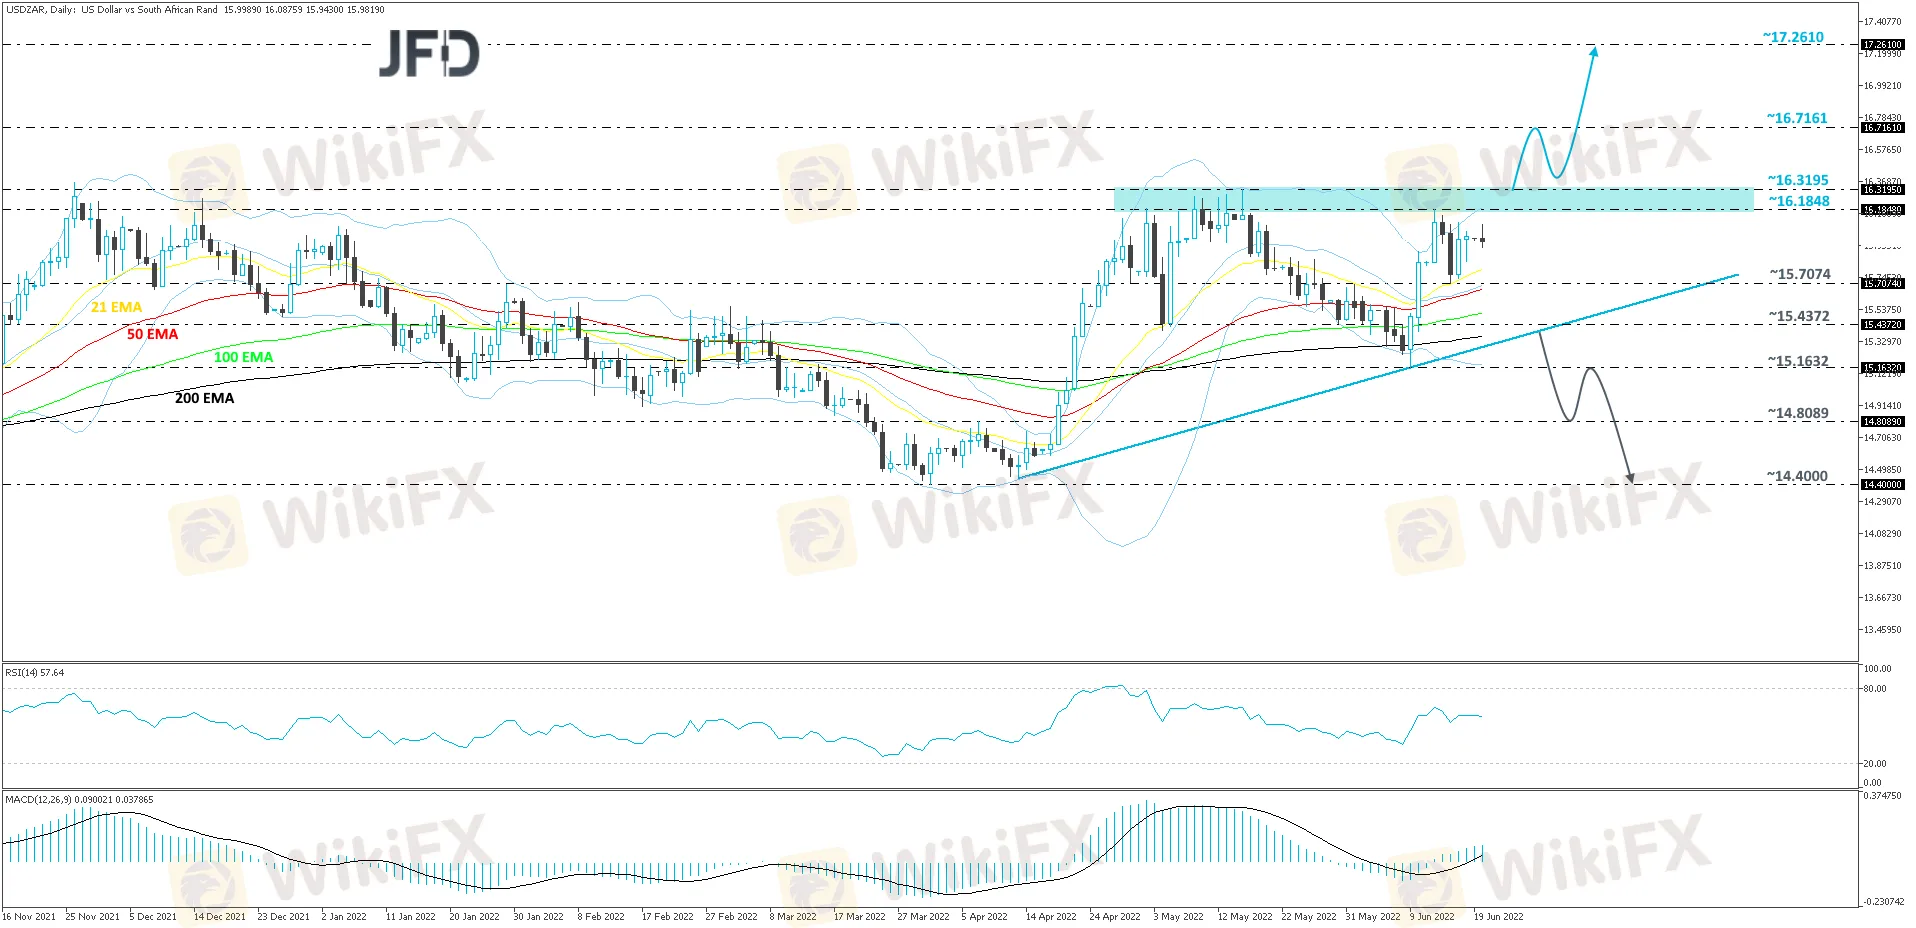
Looking at the technical picture of USD/ZAR on our daily chart, we can see that after reversing higher at the end of March, the pair is now trading above a short-term upside support line taken from the low of April 13th. That said, the rate is currently trading below a key resistance area between the 16.1848 and 16.3195 levels, marked by the highs of June 13th and May 16th respectively. In order to aim further north, we would prefer to wait for a push above that resistance area first.
Such a break will confirm a forthcoming higher high and may open the door to the 16.7161 hurdle, marked by the high of October 15th, 2020. We could see a slight hold-up around there, however, if the buyers remain strong, they might overcome that obstacle and aim for the 17.2610 zone, which is the highest point of September 2020.
The RSI is flat but continues to run above 50. The MACD is pointing higher, while running above zero and the signal line. Overall, the two oscillators show positive price momentum, which supports the upside scenario.
Alternatively, a break of the aforementioned upside line may change the direction of the current short-term trend. USD/ZAR could then drift to the current lowest point of June, at 15.1632, which was tested on the 9th of the month, a break of which might clear the way towards the 14.8089 zone. That zone marks the inside swing high of April 7th. However, if the sellers continue to apply pressure and break that zone, the next possible support area could be at 14.4000, which is the lowest point of March.

WikiFX-Broker
Aktuelle Nachrichten
Einsturz des Goldpreises: Der Gold-Boom wird weitergehen, sagen die Analysten von Goldman Sachs
 WikiFX
Hohe Aktienbewertungen und „ungeordnete Korrekturen könnten die Weltwirtschaft erschüttern, warnt der IWF
WikiFXSo teuer ist der Weg zum Milliarden-Unternehmen – laut neuer Studie
WikiFXWechselkursberechnung

