FPG AMZN Market Report May 23, 2025
Zusammenfassung:AMZN is currently traded around 202.84 after a strong recovery from recent lows. While the price is showing signs of bullish momentum, it is now approaching a significant resistance zone near 212.42.
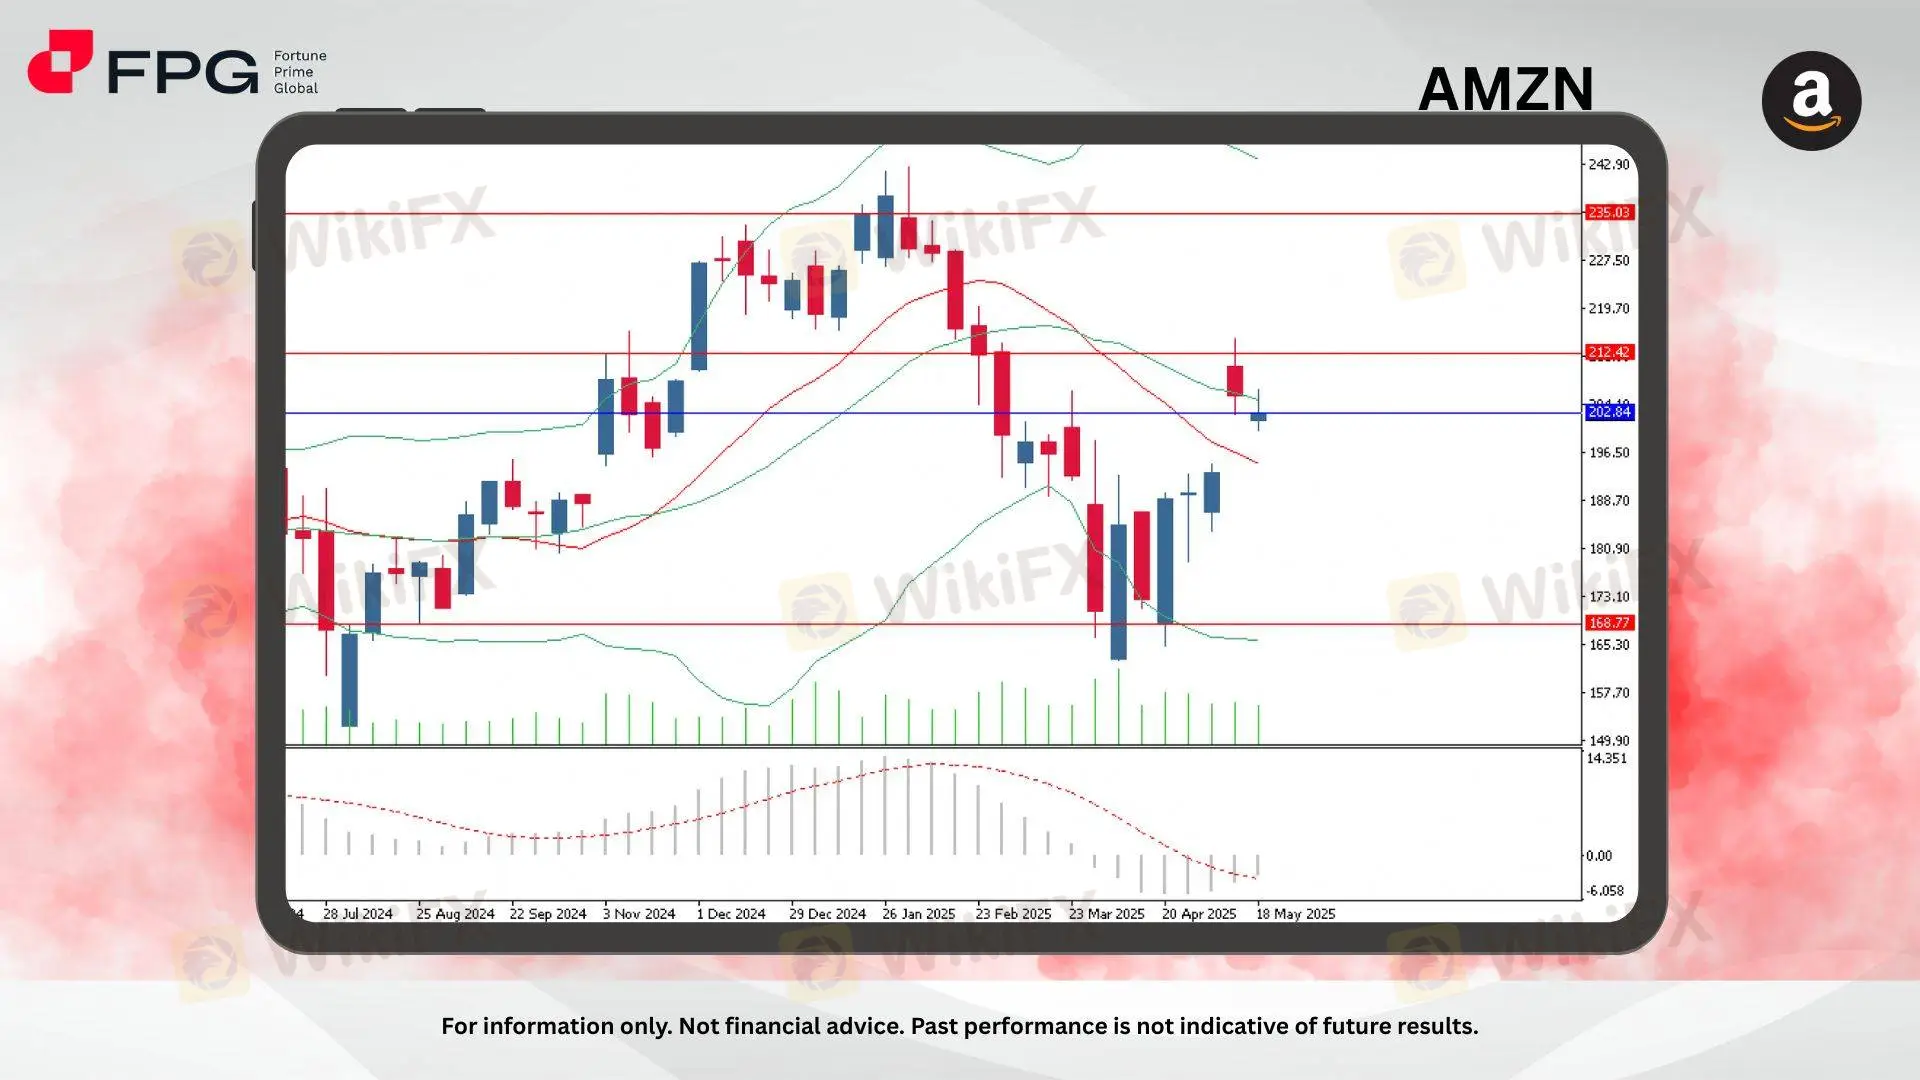
AMZN is currently traded around 202.84 after a strong recovery from recent lows. While the price is showing signs of bullish momentum, it is now approaching a significant resistance zone near 212.42. Market sentiment appears cautiously optimistic, but confirmation is needed for continuation.
Price has rebounded impressively from the March 2025 low and is now consolidating just below the 212.42 resistance level. AMZN is slightly above the 20-week moving average (the mid-Bollinger Band), reflecting a neutral-to-bullish short-term stance. The Bollinger Bands have started to narrow, indicating reduced volatility and the potential for an upcoming breakout.
MACD (12,26,9) remains in bearish territory at -2.689, with the signal line at -3.263. Although the MACD histogram is still negative, its slope is flattening, which may hint at weakening downside momentum. However, no clear bullish crossover has been formed yet. Volume is moderate, suggesting cautious market participation.
Market Observation & Strategy Advice
1. Strong Resistance zones to monitor: 212.42 and 235.03.
2. Current Position: is around 202.84, showing recent upward pressure but capped by the resistance at 212.42.
3. Important Support Levels lie at 168.77 (major weekly support).
4. Momentum Indicators: Bollinger Bands are narrowing, suggesting a consolidation phase before a possible breakout. MACD remains in bearish territory but is flattening, watch for potential crossover in coming weeks.
5. Strategy Advice:
Buy on Break Above 212.42 – With confirmation candle, target next resistance at 225–235.
Buy Pullback Toward 195–190 Area – Only if bullish reversal pattern forms near the middle band.
Avoid Aggressive Longs Below 202.84 – Breakdown below this level may lead to renewed sell-off toward 180 and 168.77.
Market Performance:
Stocks Last Price % Change
TSLA 341.04 +1.92%
NFLX 1,187.97 −0.56%
Todays Key Economic Calendar:
JP : Inflation Rate YoY
UK: Retail Sales MoM
Risk Disclaimer: This report is for informational purposes only and does not constitute financial advice. Investments involve risks, and past performance does not guarantee future results. Consult your financial advisor for personalized investment strategies.

WikiFX-Broker
Aktuelle Nachrichten
Gute Stimmung am deutschen Aktienmarkt: Starke Nvidia-Zahlen und US-Zoll-Stopp treiben den Dax
 WikiFX
Kryptowährung: Nach Kursverlusten pendelt sich der Bitcoin bei 106.000 Dollar ein
WikiFXTemu-Mutterkonzern mit fast 40 Prozent Gewinneinbruch: So hart treffen Trumps Zölle die Chinesen
WikiFXStudie: Die Preise für Neuwagen steigen in Deutschland stärker als das Einkommen
WikiFXUS-Wirtschaft schrumpft – Hohe Importe bremsen BIP im 1. Quartal
WikiFXNeues Gesetz in Florida: Gold und Silber könnten bald als offizielles Zahlungsmittel im Einsatz sein
WikiFXWechselkursberechnung
