Spotting the ‘key level’ in any market - Week 36 | Technical Analysis by Jasper Lawler
Zusammenfassung:Weekly thoughtsIs there ONE level on your chart that tells you if you are bullish or bearish?You dont have to have one, but having one is a very clear way to look at things.Admittedly sometimes there
Weekly thoughts
Is there ONE level on your chart that tells you if you are bullish or bearish?
You dont have to have one, but having one is a very clear way to look at things.
Admittedly sometimes there just isnt one - then that might be a clue not to trade that particular market
Or sometimes there is one - but it‘s far away - that’s often the case in trending markets.
By the way, I have a bit of a commodities theme this week. I know gold just hit a record high (the week after we suggested it might in the week 35 analysis) but that move has already happened.
That‘s why we’ve been researching ‘black gold’ i.e. crude oil - and two ‘commodity currencies’ CAD and NZD.
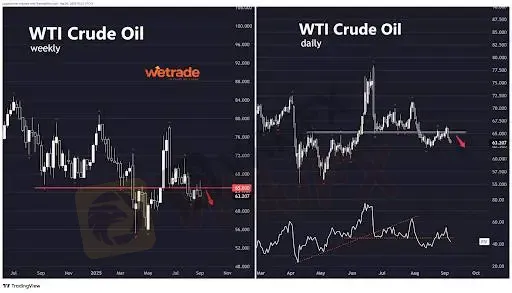
The ‘key level’ Im watching in WTI crude oil is $65 per barrel.
Apparently this is the price at which many US shale oil producers turn profitable. But I genuinely think that‘s a coincidence. It’s just a line in the sand thats formed in this market.
But why should you care about $65 per barrel?
I think you should care because this level has been at the beginning of several large reversals over the past 12 months, all of which would have been very profitable to trade.
It would be tough to call 65 in WTI either a support or resistance level because it has acted as both over the past year. I call it a ‘key level’ while some analysts call them pivots (but I think that gets mixed up with pivot points).
When you start framing markets around these key levels, it becomes much easier to filter out the noise.
It is also very useful at stopping analysis paralysis. You can very quickly filter a market:
Current price vs your key level
Youre no longer reacting to every tick on the chart, but instead asking: “Are we above or below the line?” and “What does that mean for my bias?”
Take WTI crude at $65, for example. If the market is trading comfortably above that level, you can lean bullish, knowing that historically momentum has carried higher from there. If it slips below, you switch to a more bearish framework.
This approach has a few practical applications:
Trade Filtering – You can use the level to decide whether to take trades in the direction of the trend or sit on your hands. For instance, no matter how attractive a short setup looks, if crude oil is holding above $65, youd only consider longs.
Position Sizing – Key levels help you decide when to size up or down. A breakout through $65 with strong volume could justify more aggressive risk, while a price that has already moved significantly past your level could be ready to turn back, deserving a lower position size.
Stop Placement – Instead of arbitrary stops, you can set them on the other side of the key level. That way, if the level breaks, its a clear invalidation of your idea.
The beauty of this method is its simplicity. You don‘t need ten indicators or a complicated model. Sometimes just one price on the chart tells you almost everything you need to know about the market’s balance of power.
So why am I excited about $65 now, of all times?
To me it looks like crude has chosen its direction - downwards.
Of course, I can easily tell if Im wrong when WTI crude closes back over $65 per barrel!
Setups & signals
We look at hundreds of charts each week and present you with three of our favourite setups and signals.
WTI CrudeSetup
Crude oil broke below $65 a month ago and has since failed twice to close back above it including this past week wherein it put in a bearish engulfing candlestick (a bearish signal). This idea will be negated if there is a weekly close back over 65.
Signal
Zooming into the daily chart, we can see 65 has been a local S/R zone. The failed breakout signals a likely continuation lower, setting up a retest of 60 and perhaps the lows at 55.
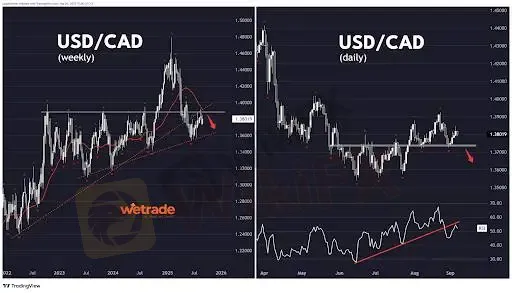
USD/CAD
Setup
The 1.39 level is the big one is USD/CAD after having been resistance throughout 2003 and 2004. Now it is being tested again as resistance from the broken rising trendline connecting the lows since 2022 and the 30 week MA.
Signal
There is a short term key level 1.372. A break below there, in combination with the break of an RSI uptrend line should confirm the new downwards bias to match the long term setup.
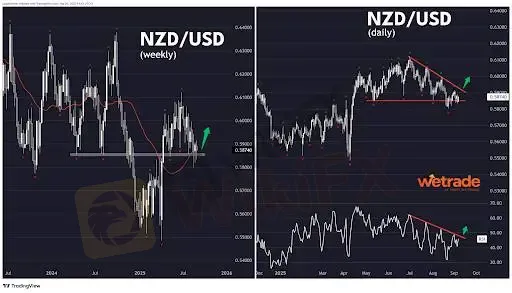
NZD/USD
Setup
The key level in NZD (as we see it) is at 0.585. Having burst above the level in the move from 0.55 to 0.61, it has pulled back to it as support alongside the 30 week MA. A move up from here could signal the end of the pullback from 0.61.
Signal
A possible breakout of the triangle pattern on the daily chart, following a false break below support could confirm the bullish trend reversal. There is a matching RSI trendline to offer confirmation.
But - as always - thats just how the team and I are seeing things, what do you think?

WikiFX-Broker
Aktuelle Nachrichten
Bitcoin unter 86.000 Dollar – institutionelle Anleger uneins, Hoffnung durch US-Liquidität
 WikiFX
Cardano unter Druck: Verkäufer dominieren weiter den Kryptomarkt
WikiFXBitMine kauft massiv Ethereum und peilt fünf Prozent des Umlaufs an
WikiFXLitecoin unter massivem Verkaufsdruck – Siebter Verlusttag in Folge
WikiFXRipple am Abgrund - oder ist das die letzte Chance vor dem Turnaround?
WikiFXXRP vor Crash? Ripple-Signal warnt: minus 60% möglich
WikiFXDer Aktienmarkt im Wandel: Plötzlich zählt mehr als nur Tech & KI
WikiFXZinsen bis zu 3,1 Prozent: Bei diesen Banken bekommt ihr im Dezember am meisten für euer Geld
WikiFXWechselkursberechnung

