Mohicans markets:The Annual Rate of the US CPI in August is not Seasonally Adjusted
Abstract:On Tuesday, September 13, spot gold tested 1723.97 resistance, and then the market faces a choice of direction; spot silver gained some support at 19.52, with the first upside target to 19.94; WTI crude oil recovered all the lost ground in the session, the primary resistance focus on 89.17; the dollar index under pressure at 108.34 below, which was down to test the 108 mark.

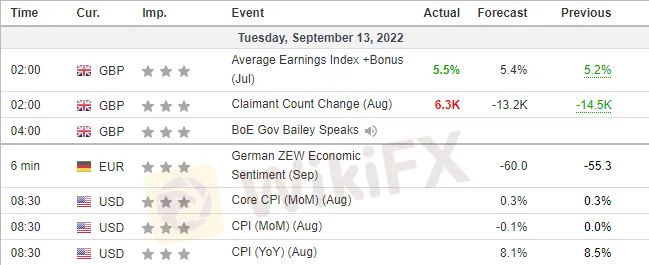
Key Data
Fundamentals overview
On Tuesday, September 13, spot gold tested 1723.97 resistance, and then the market faces a choice of direction; spot silver gained some support at 19.52, with the first upside target to 19.94; WTI crude oil recovered all the lost ground in the session, the primary resistance focus on 89.17; the dollar index under pressure at 108.34 below, which was down to test the 108 mark.
The Mohicans Markets strategy is for reference only and not as investment advice. Please read the terms of the statement at the end of the article carefully. The following strategy was updated at 16:30 on September 13, 2022, Beijing time.
Technical View
ONE · Technical Level · International Gold
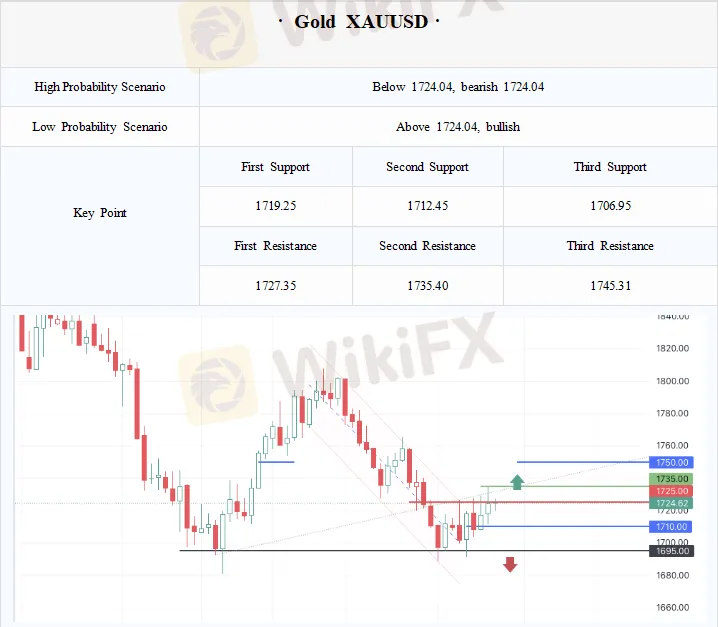
1745-1750 Bullish increase, bearish increase slightly and large stock, long target, strong resistance
1738-1740 Bullish increased sharply, bearish decrease slightly, long target and resistance
1725-1735 Bullish increase, bearish increase, long and short contention, oscillating range
1715-1720 Bullish decrease slightly, bearish increase sharply, short target
1700 Bullish decrease, bearish increase in equal amounts, short target
1690 Bullish unchanged, bearish increased, short target
Technical Analysis
Gold prices held steady above 1710 on Monday, but failed to effectively break 1730. Tonight will be released the much-anticipated U.S. CPI data in August, the data will provide further clues to the duration and aggressiveness of the Fed's tightening policy. However, it is worth noting that the data is expected to be difficult to change the market consensus of a 75 basis point Fed rate hike in September, which is why gold prices are having difficulty effectively breaking through 1730.
From the options layout, 1730-1735 still constitutes a resistance area, effective breakthrough will look up to the long target 1740, 1750. 1750 at the bearish stock is huge, and is expected to constitute a strong resistance, effective breakthrough will be further up to 1765.
On the other hand, 1715 constitutes a short term short target and support. If it falls below this level, there is a risk of retesting the 1700 mark, and support will be down to 1690-1695 or even 1675.
Note: The above strategy was updated at 16:00 on September 13. This strategy is a day strategy, please pay attention to the release time of the strategy.
TWO · Technical level · Spot silver
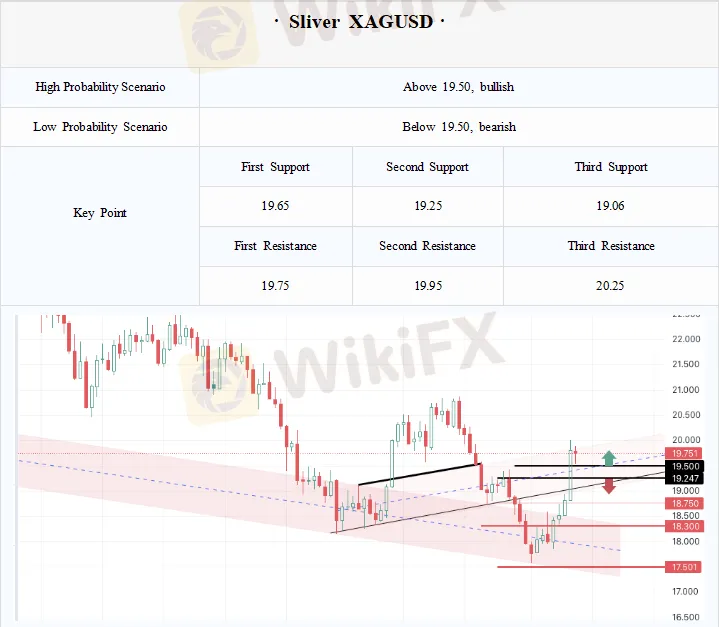
20.75, Bullish increasing, long target
20-20.05 Bullish sharply decrease, bearish increase, resistance zone
19.90 Bullish increase slightly, bearish increase, resistance zone
19.65-19.75 Bullish increase, bearish increase, long target, resistance area
19.50 Bullish increase, bearish increase, long and short contention, support
19.25 Bullish increase sharply, bearish increase, support
19 Bullish increase, bearish increase, short target
Technical Analysis
Silver rallied 5% on Monday on speculative sentiment, but gold prices did not follow suit. The gold-silver ratio also reached the bottom area in August and is wary of a rebound. In this case if the momentum of gold and silver turn down, silver is expected to have a greater retracement. TD Securities noted that the decline in the dollar has prompted a rally in silver. The rally through resistance further prompted short-covering, which drove silver prices sharply higher. However, recession fears will continue to depress industrial demand for silver in terms of its industrial properties. In terms of option changes, 19.54 and 19.28 resonate with the key point constituted by order flow, which is expected to provide support, and a break will revert down to the 19 integer level. While the 20 integer level constitutes a strong resistance zone, a break will take us up to around 20.75.
Note: The above strategy was updated at 16:00 on September 13. This strategy is a day strategy, please pay attention to the release time of the strategy.
THREE · Technical Level · US Crude Oil
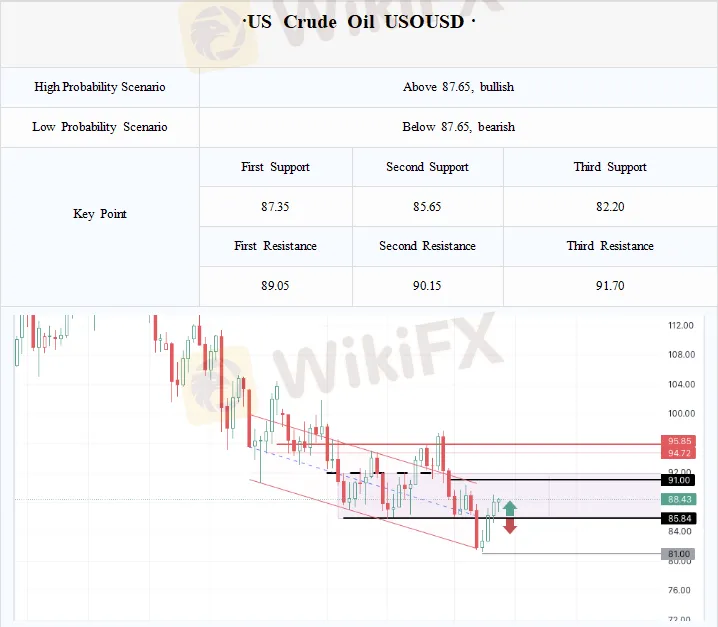
95 Bullish increase sharply and the stock is large, bearish increase slightly, medium-term long target
93 Bullish increase sharply,bearish increase increase,long target
91-91.7 strong resistance
90 Bullish increase sharply, bearish decrease, long target and resistance
88 Bullish decrease, bearish decrease sharply, resistance weaken
85 Bullish slightly decrease, bearish sharply increase, short target
82 Bullish decrease, bearish decrease sharply, support level
Technical Analysis
The dollar retreated yesterday, crude oil stabilized at 85 and broke through 87 resistance on the upside, but was stopped at 88 and fell back. In the options market, there are signs of concentrated departures from points where short stocks are dominant, with long accumulation boards betting upward on a breakout. The 88 resistance mentioned yesterday had a large loss of bearish options, with resistance weakening and stronger long forces. If crude oil moves further to the upside, a 90 long target is seen. Calls have increased their bets sharply here, but there is a good stock of puts that still pose resistance. There are also more long entries above 91 and 93, which are secondary long targets. 95 also has long bets on a medium-term upside move. On the other hand, intraday attention also needs to be paid to crude oil's defense at 85. This was the starting point yesterday afternoon and poses some support for oil prices. However, there are also a number of short bets, and if it loses ground you need to be wary of a further break down in crude. 82 is around where a large number of shorts left the market and the downside action weakened, constituting some support.
Note: The above strategy was updated at 16:00 on September 13. This strategy is a day strategy, please pay attention to the release time of the strategy.
FOUR · Technical level · EUR/USD
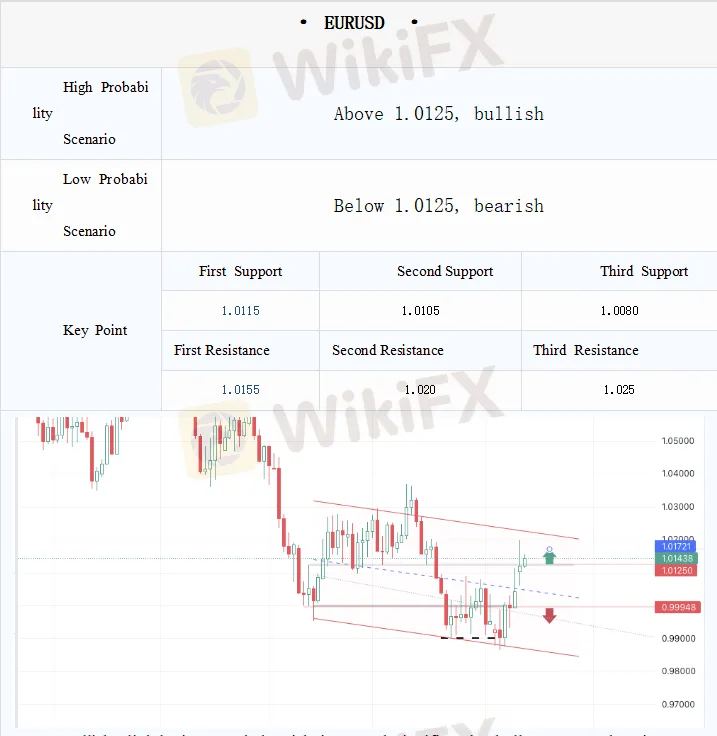
1.025 Bullish slightly increased, bearish increased significantly, bulls target and resistance
1.02 Bullishness decreases, bearish increases significantly and the stock is large, and the resistance increases
1.015 Bullish has slightly decreased, bearish has increased significantly and the stock is large, the rebound target and resistance
1.01 Bullish slightly reduced, bearish increased, falling target and support
1.005 Bullish unchanged, bearish increased sharply, bear target and support
1.00 Bullish decrease, bearish increase sharply and the stock is large, the next bearish target
Technical Analysis
On Monday, stimulated by the good news of the conflict between Russia and Ukraine, Europe and the United States strengthened sharply, successfully breaking through the resistance of 1.01 and entering the range of 1.01-1.02, but later blocked by the upper resistance of 1.02 and fell back some of the gains.
In terms of options, short bets near the current price have an advantage, and the resistance above is significantly strengthened. Among them, the short bets near 1.015 are intensive, which will be the rebound target and resistance. The resistance 1.02 that could be broken through at the end of yesterday also received attention from the bears again. If it breaks through, it may test the long target of 1.025.
Downward put options still add new bets, 1.01 as the bottom of the current range, will be the target and support for the fall. If it falls below, it may look to the short target of 1.005, and then the bearish funds near the parity are still relatively dense, which will be the next short target.
Note: The above strategy was updated at 16:00 on September 13. This strategy is a day strategy, please pay attention to the release time of the strategy.
FIVE · Technical Level · GBPUSD
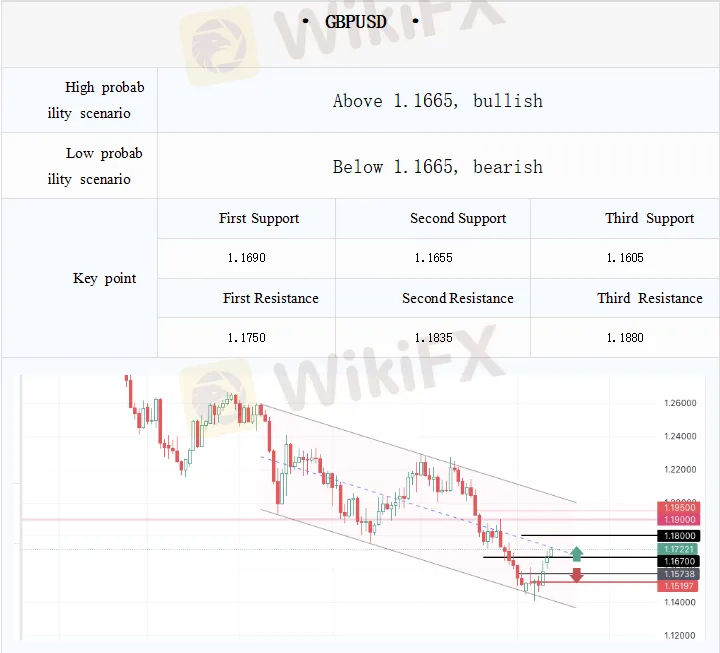
1.18 Bullish increase, bearish decrease slightly, long target
1.175 Bullish slightly increased, bearish decreased slightly, rebound target
1.17 Bullish unchanged, bearish unchanged, first resistance
1.165 Bullish unchanged, bearish increase sharply, falling target and support
1.16 Bullish remains unchanged, bearish increases significantly and the stock is large, and the bearish target and support
1.155 Bullish unchanged, bearish increased significantly and the stock is large, bearish target
Technical Analysis
GBPUSD also rebounded yesterday, successfully breaking through yesterday's rebound target and resistance at 1.165, but was finally blocked at 1.17 and is still below 1.17.
In terms of option distribution, long and short bets near the current price are relatively thin, and funds are on the sidelines. Longs basically focus on adding new bets above 1.18, while shorts are below 1.165, and there is an obvious entry. Since 1.17 is the only exit position for the nearby bulls, it may be the first resistance for the rebound. If it breaks through, it may look towards the rebound target of 1.175 and the bulls target of 1.18.
On the downside, 1.165 will be the target and support for the fall. If it falls below, the GBPUSD may look to the short target of 1.16 and 1.155, and the short bets in these two positions are relatively intensive.
Note: The above strategy was updated at 16:00 on September 13. This strategy is a day strategy, please pay attention to the release time of the strategy.
SIX · Technical level · AUD/USD
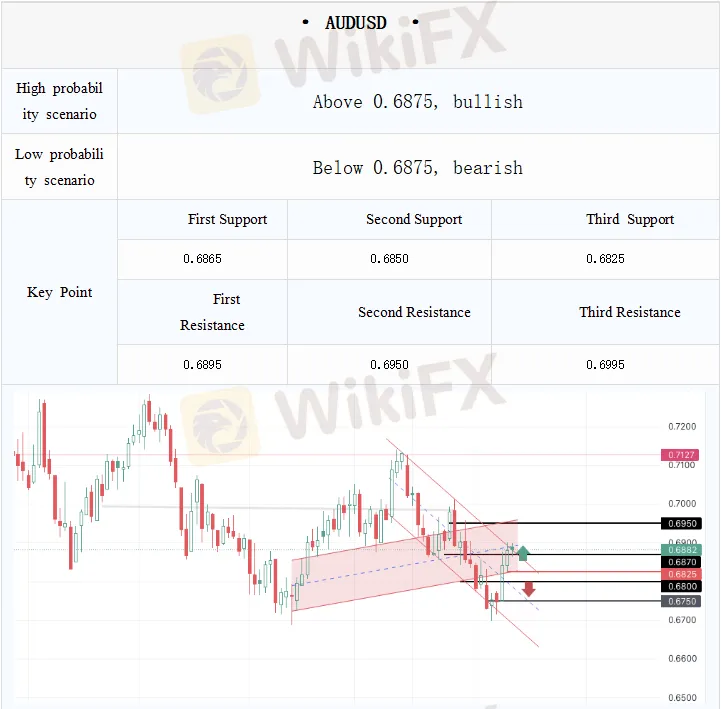
0.7 Bullish reduced greatly, bearish unchanged, and the upward momentum has weakened
0.695 Bullish increase, bearish increase, resistance level
0.69 Bullish unchanged, bearish increase sharply, resistance level
0.685 Bullish unchanged, bearish increase, short-term bearish target
0.58 Bullish decrease sharply, bearish increase sharply, bears target
0.675 Bullish slightly increased, bearish increased significantly, downtrend energy is extended
Technical Analysis
Yesterday, the Australian dollar broke through the resistance, but failed to successfully complete the upward target, and encountered resistance near 0.69.
From the perspective of options holdings, the willingness of longs to increase positions is insufficient. At the point where the long stock is dominant, a large number of call options leave the market, while at the point where the short bet is large, there are still a large number of put options entering the market, and the Australian dollar's upward trend may be further hindered.
Above 0.69, there are 500 put option bets, and the resistance is strengthened. Australia and the United States may further test the resistance in the day, and focus on whether it can break through smoothly. 0.95 is a secondary resistance, but the stock of longs and shorts is equal, the resistance is slightly weaker than 0.69, and the bulls are betting on the upside one after another. 0.7 Although there is a large stock of bulls, there are signs of leaving the market, and the confidence of bulls to bet on the rise has weakened.
On the other hand, the bulls at 0.68 below left the market in large numbers, the support strength weakened, and the bears entered the market at the same time, which was a short-term bearish target. If Australia and the United States continue to break down, the weak long stock below will provide favorable support, and the shorts around 0.675 will enter the market one after another to bet on the decline.
Note: The above strategy was updated at 16:00 on September 13. This strategy is a day strategy, please pay attention to the release time of the strategy.
Statement | Disclaimer
Disclaimer: The information contained in this material is for general advice only. It does not take into account your investment goals, financial situation or special needs. Mohicans Markets has made every effort to ensure the accuracy of the information as of the date of publication. Mohicans Markets makes no warranties or representations regarding this material. The examples in this material are for illustration only. To the extent permitted by law, Mohicans Markets and its employees shall not be liable for any loss or damage arising in any way, including negligence, from any information provided or omitted from this material.The features of Mohicans Markets products, including applicable fees and charges, are outlined in the product disclosure statements available on the Mohicans Markets website and should be considered before deciding to deal with these products. Derivatives can be risky and losses can exceed your initial payment. Mohicans Markets recommends that you seek independent advice.
Mohicans Markets, (Abbreviation: MHMarkets or MHM, Chinese name: Mai hui), Australian Financial Services License No. 001296777.


Read more

Mohicans markets:European Market
On Monday, October 10, during the Asian session, spot gold shock slightly down, and is currently trading near $ 1686 per ounce. Last Friday's better-than-market-expected U.S. non-farm payrolls report for September reinforced expectations that the Federal Reserve will raise interest rates sharply, and the dollar and U.S. bond yields surged and recorded three consecutive positive days, causing gold prices to weaken sharply.

Mohicans markets:Hitting Exhibition| See the Grand Occasion of Dubai Exhibition!
Focus on the industry highlight event, and explore the new future of trading. MHMarkets, the world's leading currency and CFD broker, is committed to providing better trading services to global traders and expanding its international markets.

Mohicans markets :MHM Today’s News
On Thursday, spot gold first fell and then rose. The US market once rose to a high of $1,664.78, and finally closed up 0.04% at $1,660.57 per ounce; spot silver finally closed down 0.34% at $18.82 per ounce.

Mohicans markets:Daily European Market Viewpoint
On Thursday, September 29, during the Asia-Europe period, spot gold fluctuated slightly and was currently trading around $1,652.26 an ounce. U.S. crude oil fluctuated in a narrow range and is currently trading around $81.63 a barrel, holding on to its sharp overnight gains.
WikiFX Broker
Latest News
Telegram Investment Promises Turn Costly as Civil Servant Loses Nearly RM100,000 in 2 Separate Scams
 WikiFX
TRADEDEAL Review 2026: Unverified Regulation and Warning Signals
WikiFXFM-Fund Review 2026: Unregulated Status and High-Risk Signals
WikiFXOman’s FSA Warns Against Open Gate Trading as Website Claims Regulation
WikiFXBeeMarkets Review 2026: Is it Legit or a Scam? Read This Investigation
WikiFXInflation rate projected to hit 6% in the second quarter, top economic forecasters say
WikiFXOil Crosses $101 On Shipping Blockade
WikiFXCrude Shocks Meet Asian Inflation Surges
WikiFXStrong Dollar Sinks Asian Currencies
WikiFXCFDInterbank Review 2026: Unregulated Offshore Profile and Key Risk Signals
WikiFXRate Calc

