MHMarkets:Dollar pairs open up space on the upside, non-US currencies and precious metals are long and short, and US crude oil continues to be weak!
Abstract:On Wednesday (August 16), spot gold narrowly oscillated during the Asian session, and is currently trading near $1904.84 per ounce. Overnight U.S. retail sales data was strong, fueling speculation that the Fed's interest rate hike cycle has not yet ended, so that gold prices continue to be under pressure. However, gold prices are still supported by the 1900 mark, the bulls still leave some opportunities.

Market Overview
On Wednesday (August 16), spot gold narrowly oscillated during the Asian session, and is currently trading near $1904.84 per ounce. Overnight U.S. retail sales data was strong, fueling speculation that the Fed's interest rate hike cycle has not yet ended, so that gold prices continue to be under pressure. However, gold prices are still supported by the 1900 mark, the bulls still leave some opportunities.
Market attention turned to the Federal Reserve meeting minutes, the minutes will be out at 2:00 a.m. Beijing time on Thursday, the Fed in July to maintain the current interest rates unchanged, the minutes of the meeting bias dovish possibility is a little higher, which is expected to give the price of gold to provide some rebound opportunities. In addition, investors also need to pay attention to the U.S. housing market data, this trading day will come out of the U.S. in July the total annualized number of new housing starts and the U.S. in July the total annualized number of building permits.
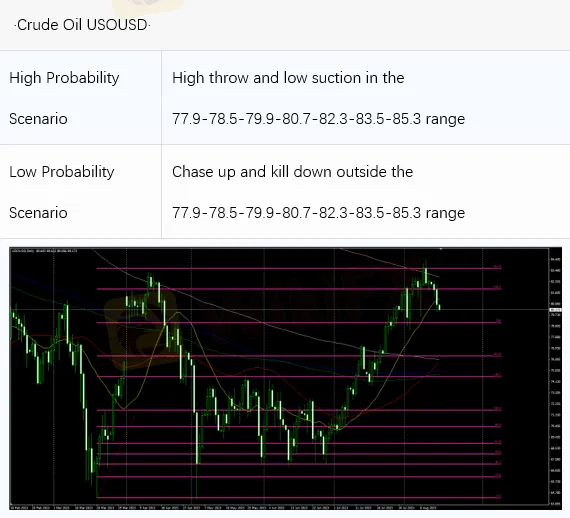
U.S. crude oil has weakened and is currently trading near $80.60 per barrel. Because the Chinese economic data out this week was weaker than market expectations, the market's concerns about the outlook for crude oil demand heated up, and oil prices continued to fall, further away from the nearly nine-month high hit last week. Despite the sharp decline in API crude inventories, it failed to provide significant support to oil prices, and there is still a further downside risk for oil prices in the short term.
This trading day will usher in the U.S. EIA crude oil inventory data series, investors need to pay attention to. And watch out for the U.S. housing market data and the performance of the Federal Reserve meeting minutes.
MHMarkets strategy is only for reference and not for investment advice. Please carefully read the statement at the end of the text. The following strategy will be updated at 15:00 on August 16, Beijing time.

Intraday Oscillation Range: 1873-1889-1903-1919-1929-1937-1951-1960
Overall Oscillation Range: 1730-1756-1780-1801-1817-1833-1856-1873-1889-1903-1919-1929-1937-1951-1960-1977-1985-1998-2007-2016-2033-2046-2057-2066-2077-2089-2097-2100
In the subsequent period of spot gold, 1873-1889-1903-1919-1929-1937-1951-1960 can be operated as the bull and bear range; High throw low suction in the range, chase up and kill down outside the range!
Note: The above strategy was updated at 15:00 on August 16. This policy is a daytime policy. Please pay attention to the policy release time.

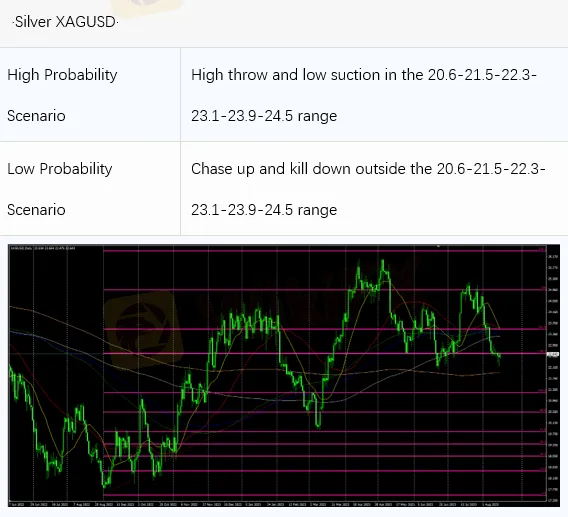
Intraday Oscillation Range: 20.6-21.5-22.3-23.1-23.9-24.5
Overall Oscillation Range: 19.7-20.1-20.6-21.5-22.3-23.1-23.9-24.5-25.3-26.1-26.6-27.3
In the subsequent period of spot silver, 20.6-21.5-22.3-23.1-23.9-24.5 can be operated as the bull and bear range. High throw and low suction in the range, chase up and kill down outside the range!
Note: The above strategy was updated at 15:00 on August 16. This policy is a daytime policy. Please pay attention to the policy release time.

Intraday Oscillation Range: 77.9-78.5-79.9-80.7-82.3-83.5-85.3
Overall Oscillation Range: 62.1-63.7-64.5-65.8-66.9-67.3-68.9-70.1-71.2-72.3-73.1-73.8-75.1-77.9-78.5-79.9-80.7-82.3-83.5-85.3-87.3-89.1-90.7
In the subsequent period of crude oil, 77.9-78.5-79.9-80.7-82.3-83.5-85.3 can be operated as the bull and bear range. High throw and low suction in the range, chase up and kill down outside the range!
Note: The above strategy was updated at 15:00 on August 16. This policy is a daytime policy. Please pay attention to the policy release time.

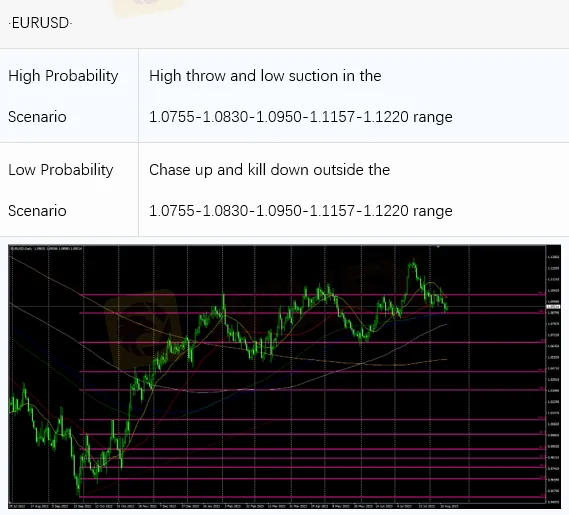
Intraday Oscillation Range:1.0755-1.0830-1.0950-1.1157-1.1220
Overall Oscillation Range: 1.0290-1.0360-1.0460-1.0570-1.0690-1.0755-1.0830-1.0950-1.1157-1.1220-1.1303-1.13340
In the subsequent period of EURUSD, 1.0755-1.0830-1.0950-1.1157-1.1220can be operated as the bull and bear range. High throw and low suction in the range, chase up and kill down outside the range!
Note: The above strategy was updated at 15:00 on August 16. This policy is a daytime policy. Please pay attention to the policy release time.

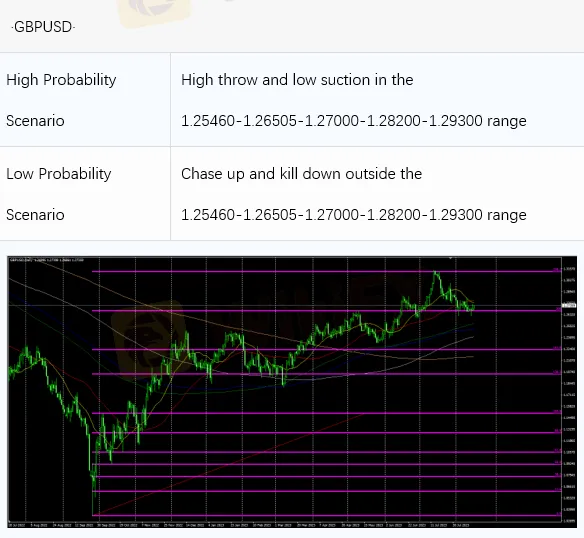
Intraday Oscillation Range:1.25460-1.26505-1.27000-1.28200-1.29300
Overall Oscillation Range: 1.1610-1.1830-1.1920-1.2030-1.2135-1.2250-1.2375-1.2400-1.2470-1.25460-1.26505-1.27000-1.28200-1.29300-1.30000-1.30600-1.31000-1.31660-132000
In the subsequent period of GBPUSD, 1.25460-1.26505-1.27000-1.28200-1.29300 can be operated as the bull and bear range. High throw and low suction in the range, chase up and kill down outside the range!
Note: The above strategy was updated at 15:00 on August 16. This policy is a daytime policy. Please pay attention to the policy release time.

Read more

MHMarkets:2024.03.29 MHM European Time Analysis
Fed Governor Christopher Waller's recent comments have highlighted a cautious stance towards adjusting interest rates, marking a significant moment for the financial markets.

MHMarkets:2024.03.28 MHM European Time Analysis
In the forex market, stability was the theme for the U.S. dollar index, holding firm at 104.30. Minor fluctuations were observed across major currency pairs: the Euro slightly weakened against the dollar, closing at 1.0827

MHMarkets:2024.03.27 MHM European Time Analysis
In the latest market wrap focusing on the foreign exchange sector, the U.S. dollar index showed minimal movement, holding at 104.31.

MHMarkets:March 27, 2024 Economic Highlights
On Tuesday, due to February's US durable goods orders growth exceeding expectations and an optimistic economic growth outlook for the first quarter in the US, the US dollar index initially fell but then rose, briefly touching below the 104 mark before recovering during the US trading session, closing up 0.07% at 104.29.
WikiFX Broker
Latest News
FINRA Fines Cetera $1.1 Million Over Compliance Lapses
FINRA Fines Cetera $1.1 Million Over Compliance Lapses
Upway (JRJR) Review: A Deep Dive into Safety and Regulation
Coinbase Banks Push Advances Crypto Rules
RM668K Gone Overnight: Factory Supervisor Trapped in Fake Investment Scam
Dollar Softens as Fed Signals Shifts; Warsh Leads Nomination Race
Safe-Haven Supercycle: Gold Hits $4,690 as Silver Squeeze Intensifies
Trans-Atlantic Rupture: Markets Brace for Trade War as Trump Issues Greenland Ultimatum
China Delivers 5% Growth Target, Yet December Data Reveals Deepening Consumption and Property Cracks
Italy’s Consob Blocks Five Unauthorized Investment Websites in New Enforcement Action
Rate Calc

