2025-01-29 17:09
IndustriIntroduction to Stochastic Oscillators in Forex
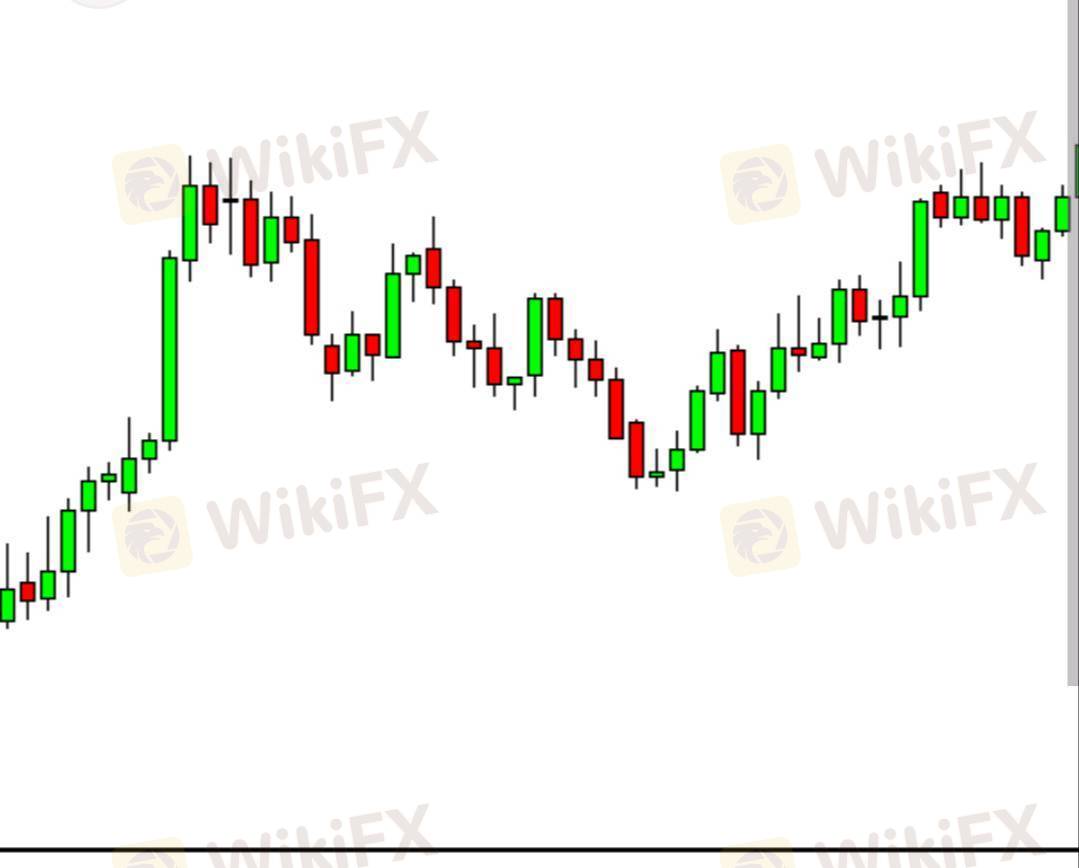
A Stochastic Oscillator in Forex is a momentum indicator used to identify potential trend reversals by comparing a currency pair's closing price to its recent price range over a specified period, typically indicating overbought or oversold conditions when the reading falls above 80 or below 20 respectively, helping traders anticipate potential price corrections; it is represented by two lines, %K (fast line) and %D (slow line), with buy signals often occurring when the %K line crosses above the %D line from below and sell signals when it crosses below the %D line from above.
Suka 0
FX2489435150
ट्रेडर
Diskusi populer
Industri
СЕКРЕТ ЖЕНСКОГО ФОРЕКСА
Industri
УКРАИНА СОБИРАЕТСЯ СТАТЬ ЛИДЕРОМ НА РЫНКЕ NFT
Industri
Alasan Investasi Bodong Tumbuh Subur di Indonesia
Industri
Forex Eropa EURUSD 29 Maret: Berusaha Naik dari Terendah 4 Bulan
Analisis pasar
Bursa Asia Kebakaran, Eh... IHSG Ikut-ikutan
Analisis pasar
Kinerja BUMN Karya Disinggung Dahlan Iskan, Sahamnya Pada Rontok
Klasifikasi pasar

Platform

Pameran

Agen

Perekrutan

EA

Industri

Pasar

Indeks
Introduction to Stochastic Oscillators in Forex
 Nigeria | 2025-01-29 17:09
A Stochastic Oscillator in Forex is a momentum indicator used to identify potential trend reversals by comparing a currency pair's closing price to its recent price range over a specified period, typically indicating overbought or oversold conditions when the reading falls above 80 or below 20 respectively, helping traders anticipate potential price corrections; it is represented by two lines, %K (fast line) and %D (slow line), with buy signals often occurring when the %K line crosses above the %D line from below and sell signals when it crosses below the %D line from above.
Suka 0
Saya juga ingin komentar
Tanyakan pertanyaan
0Komentar

Belum ada yang berkomentar, segera jadi yang pertama

Tanyakan pertanyaan
Belum ada yang berkomentar, segera jadi yang pertama