
2025-01-30 18:38
IndustriWhat Are Candlestick Patterns in Crypto Trading?
#firstdealofthenewyearFateema
Candlestick patterns in crypto trading are visual representations of price movements within a specific time frame. Each candlestick shows four key price points:
Open – The price at which the asset started trading during the time frame.
Close – The price at which the asset ended trading during the time frame.
High – The highest price reached during the time frame.
Low – The lowest price reached during the time frame.
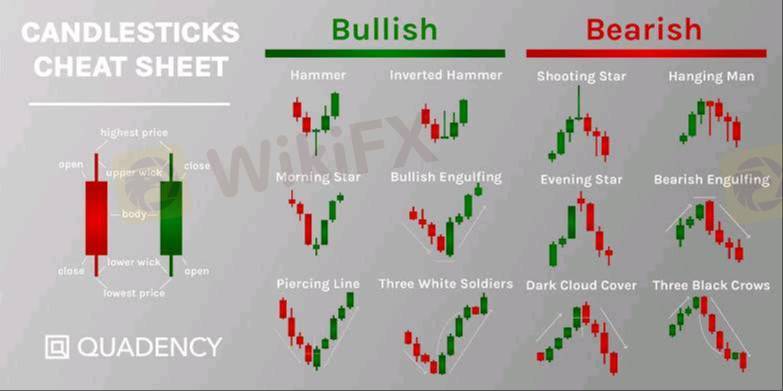
Structure of a Candlestick:
Body: The colored or filled part of the candlestick, showing the difference between the opening and closing prices.
Wicks (Shadows): Thin lines extending from the top and bottom, indicating the high and low prices.
Common Candlestick Patterns:
Bullish Patterns (Indicating a Potential Uptrend)
1. Bullish Engulfing – A large green candle completely engulfs the previous red candle, signaling strong buying pressure.
2. Hammer – A small body with a long lower wick, showing rejection of lower prices and a possible reversal upward.
3. Morning Star – A three-candle pattern signaling the end of a downtrend and the start of an uptrend.
Bearish Patterns (Indicating a Potential Downtrend)
1. Bearish Engulfing – A large red candle engulfs the previous green candle, signaling strong selling pressure.
2. Shooting Star – A small body with a long upper wick, showing rejection of higher prices and a possible downward reversal.
3. Evening Star – A three-candle pattern signaling the end of an uptrend and the start of a downtrend.
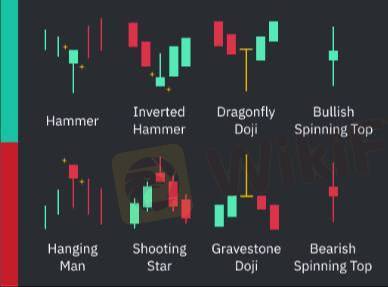
Neutral/Continuation Patterns
1. Doji – A candle where the open and close are nearly the same, signaling market indecision.
2. Spinning Top – A small-bodied candle with long wicks, indicating uncertainty.
3. Inside Bar – A smaller candle forming within the range of the previous larger candle, often leading to a breakout.
How Traders Use Candlestick Patterns
Traders analyze candlestick patterns alongside technical indicators (e.g., RSI, moving averages, volume) to predict potential price movements. While no pattern guarantees accuracy, they help traders make informed decisions on entries, exits, and risk management.
Would you like a detailed breakdown of a specific pattern?
Suka 0

uwakmfon48
Trader
Diskusi populer
Industri
СЕКРЕТ ЖЕНСКОГО ФОРЕКСА
Industri
УКРАИНА СОБИРАЕТСЯ СТАТЬ ЛИДЕРОМ НА РЫНКЕ NFT
Industri
Alasan Investasi Bodong Tumbuh Subur di Indonesia
Industri
Forex Eropa EURUSD 29 Maret: Berusaha Naik dari Terendah 4 Bulan
Analisis pasar
Bursa Asia Kebakaran, Eh... IHSG Ikut-ikutan
Analisis pasar
Kinerja BUMN Karya Disinggung Dahlan Iskan, Sahamnya Pada Rontok
Klasifikasi pasar

Platform

Pameran

Agen

Perekrutan

EA

Industri

Pasar

Indeks
What Are Candlestick Patterns in Crypto Trading?
Nigeria | 2025-01-30 18:38#firstdealofthenewyearFateema
Candlestick patterns in crypto trading are visual representations of price movements within a specific time frame. Each candlestick shows four key price points:
Open – The price at which the asset started trading during the time frame.
Close – The price at which the asset ended trading during the time frame.
High – The highest price reached during the time frame.
Low – The lowest price reached during the time frame.
Structure of a Candlestick:
Body: The colored or filled part of the candlestick, showing the difference between the opening and closing prices.
Wicks (Shadows): Thin lines extending from the top and bottom, indicating the high and low prices.
Common Candlestick Patterns:
Bullish Patterns (Indicating a Potential Uptrend)
1. Bullish Engulfing – A large green candle completely engulfs the previous red candle, signaling strong buying pressure.
2. Hammer – A small body with a long lower wick, showing rejection of lower prices and a possible reversal upward.
3. Morning Star – A three-candle pattern signaling the end of a downtrend and the start of an uptrend.
Bearish Patterns (Indicating a Potential Downtrend)
1. Bearish Engulfing – A large red candle engulfs the previous green candle, signaling strong selling pressure.
2. Shooting Star – A small body with a long upper wick, showing rejection of higher prices and a possible downward reversal.
3. Evening Star – A three-candle pattern signaling the end of an uptrend and the start of a downtrend.
Neutral/Continuation Patterns
1. Doji – A candle where the open and close are nearly the same, signaling market indecision.
2. Spinning Top – A small-bodied candle with long wicks, indicating uncertainty.
3. Inside Bar – A smaller candle forming within the range of the previous larger candle, often leading to a breakout.
How Traders Use Candlestick Patterns
Traders analyze candlestick patterns alongside technical indicators (e.g., RSI, moving averages, volume) to predict potential price movements. While no pattern guarantees accuracy, they help traders make informed decisions on entries, exits, and risk management.
Would you like a detailed breakdown of a specific pattern?
Suka 0
Saya juga ingin komentar
Tanyakan pertanyaan
0Komentar

Belum ada yang berkomentar, segera jadi yang pertama
Tanyakan pertanyaan
Belum ada yang berkomentar, segera jadi yang pertama