Today's analysis: USDJPY Poised for Increase Amid Bank of Japan's Strategy
Abstract:The USD/JPY is expected to rise. The Bank of Japan will keep interest rates between 0 and 0.1% and continue its bond purchase plan but may reduce purchases and raise rates in July based on economic data. Technically, the pair is trending upward with resistance at $158.25 and $158.44, and support at $157.00, $156.16, and $155.93.
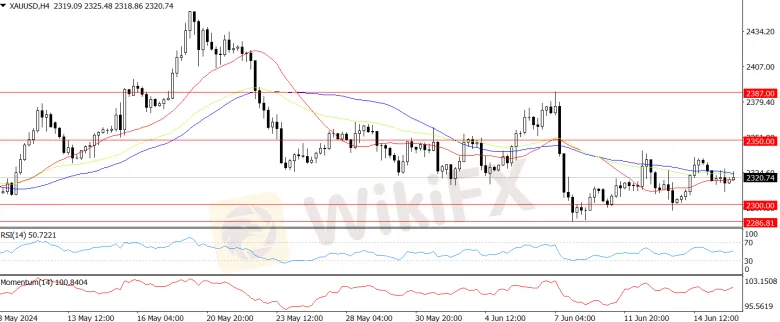
Product: XAU/USD
Prediction: Decrease
Fundamental Analysis:
The price of gold briefly fell to $2315 but then bounced back to $2321. The Federal Reserve's latest forecast, announced last week, shows that the average prediction of 19 central bank officials is that there will be only one interest rate cut this year. Some officials think the rate cut might happen in December. Israel announced a temporary ceasefire to allow aid but said they will continue their attacks in Rafah. There are no important economic reports from the US this week to help clarify the Federal Reserve's future plans.
Technical Analysis:
The gold prices are neutral to slightly negative. Momentum indicators show that sellers are gaining strength as the 14-RSI moves further into the bearish zone, which could lead to more price drops. If gold prices fall below $2,300, the first support level will be the low point of $2,277 on May 3, followed by the high point of $2,222 on March 21. If gold prices bounce back and surpass the high point of $2,387 on June 7, they could then test the $2,400 level.
Product: EUR/USD
Prediction:Decrease
Fundamental Analysis:
On Monday, the only important data in the US economic calendar will be the Empire State Manufacturing Survey for June, released by the Federal Reserve Bank of New York. However, investors are expected to pay more attention to what central bank officials say. If these officials hint at a possible rate cut later in the year, the USD might stay strong, putting pressure on the EUR/USD. But if they suggest they might change policy in September, the USD could weaken.
Technical Analysis:
The EUR/USD exchange rate went up on Monday, continuing its rise from last Friday's low point of around $1.0670. It is still trading below the 200-hour EMA at $1.0770. Because it keeps making lower highs, there is a risk that it might keep falling. The daily charts show a strong downward trend after dropping from the 200-day EMA at $1.0803. Even though there is some positive momentum that might cause a bounce from below $1.0700, the pressure from the pattern of lower highs since December's peak near $1.1140 is making it difficult for the price to rise.

Product: USD/JPY
Prediction: Increase
Fundamental Analysis:
On the 14th, the Bank of Japan announced after its monetary policy meeting that it will keep its policy interest rate target unchanged between 0 and 0.1%. The Bank also said it will continue with the long-term government bond purchase plan set in March but will reduce bond purchases in the future and decide on a specific reduction plan in July. The Bank of Japan's Governor said they are closely watching the impact of the weak yen on inflation and may raise interest rates in July, depending on economic data.
Technical Analysis:
The USD/JPY is still going up, but Monday's trading shows that buyers are being careful because they worry about Japanese authorities stepping in. The next resistance level is $158.25, which was the high on June 17, followed by $158.44, the peak on April 26. On the other hand, if USD/JPY falls below $157.00, sellers might target important support levels. The first support level is $156.16, followed by $155.93.

Product:BTC/USD
Prediction:Decrease
Fundamental Analysis:
In the five days since June 10, the Bitcoin spot ETF saw money flow out on four days. However, analysts say that long-term investors are not worrying and are still buying. The number of large wallets holding 10 or more Bitcoins has reached 16.6 million, the highest level since June 2022. Although Bitcoin looks weak in the short term, it is still within its range, and it is likely to see buying at the support level. The longer it stays in the range, the more strength it will take to break out of it.
Technical Analysis:
Bitcoin couldn't bounce back from the 50-day moving average of $66,189, showing that sellers are still putting pressure on it. The key support level to watch now is $64,602. If it drops below this level, Bitcoin could fall to $60,000. If they want to make a comeback, they need to quickly push the price above the 20-day moving average of $67,612. If they succeed, Bitcoin could rise to $70,000.

Market Analysis Disclaimer:
The market analysis provided by KVB Prime Limited is for informational purposes only and should not be construed as investment advice or a recommendation to buy or sell any financial instrument. Trading forex and other financial markets involves significant risk, and past performance is not indicative of future results.
KVB Prime Limited does not guarantee the accuracy, completeness, or timeliness of the information provided in the market analysis. The content is subject to change without notice and may not always reflect the most current market developments or conditions.
Clients and readers are solely responsible for their own investment decisions and should seek independent financial advice from qualified professionals before making any trading or investment decisions. KVB Prime Limited shall not be liable for any losses, damages, or other liabilities arising from the use of or reliance on the market analysis provided.
By accessing or using the market analysis provided by KVB Prime Limited, clients and readers acknowledge and agree to the terms of this disclaimer.
RISK WARNING IN TRADING
Transactions via margin involve products that use leverage mechanisms, carry high risks, and are certainly not suitable for all investors. THERE IS NO GUARANTEE OF PROFIT on your investment, so be wary of those who guarantee profits in trading. You are advised not to use funds if you are not prepared to incur losses. Before deciding to trade, ensure that you understand the risks involved and also consider your experience.

Read more

EGRs vs ETFs - Which is a Better Way to Invest in Gold?
The National Stock Exchange (NSE) recently launched Electronic Gold Receipts (EGRs), a digital way to invest in exchange-backed physical gold. A little less than four years ago, the Bombay Stock Exchange (BSE) introduced EGRs in October 2022. Gold Exchange Traded Funds (ETFs), another useful way to invest in gold, have already been in the market for a long time. So, the debate keeps happening on EGRs vs ETFs among gold buyers in India. In this article, we have defined and compared these two to find which one benefits you more.

LOYAL PRIMUS Review: Allegations of Account Disablement and Withdrawal Denials
Did your attempt to withdraw funds from the LOYAL PRIMUS platform lead to your account deactivation by the broker? Did the broker prevent you from withdrawing when you made profits? Did the broker cancel your withdrawal application by accusing you of suspicious trading activity? These allegations have grown in numbers on independent broker review tools such as WikiFX. In this LOYAL PRIMUS review article, we have examined all these allegations thoroughly.

Top Secrets Why the Indian Government Appeals for a NO Gold Purchase
Is it the effect of ongoing Israel-Iran-US conflict, the surging import of the yellow metal or any other economic indicators that the Indian Prime Minister made an appeal to the countrymen to stop buying gold for a year? Addressing the public rally, the PM also advised postponing travel, limiting the use of petrol, diesel and cooking oil, and transitioning to the work from home model as much as possible. He categorically mentioned: Save dollars, conserve India’s foreign exchange reserves. Read on!

India’s Love Affair with Gold: Investment Demand Rises 40% of Consumption in CY25
In the latest news that further establishes India as the destination for gold, the data issued by CareEdge Ratings demonstrated the country’s never-ending love for the yellow metal with a record investment surge of approximately 40% of overall consumption in Calendar Year 2025. This is arguably the highest in recent times. The ETF inflows alone added 37.5 tonnes, surpassing the combined investment of the last ten years. According to the ratings agency, geopolitical uncertainty and record prices made people quickly move away from jewellery.
WikiFX Broker
Latest News
RoboMarkets Review: Regulation Questions Around a Broker Facing Fresh Trading Complaints
 WikiFX
Review 2026: Deriv Regulation, Complaints, and Withdrawal Risk Signals
WikiFXStop Trading in the Middle of Ranging Forex Markets
WikiFXSTONE WALL CAPITAL Review 2026: Is This Forex Broker Safe?
WikiFXUnderstanding Day Trading: Fast Decisions, High Stress, and Zero Overnight Risk
WikiFXErrante Review: Regulation Alarms and Broker Complaints Traders Cannot Ignore
WikiFXFXTF Review 2026: FSA Regulation, MT4 Access, and Mixed Trader Reports
WikiFXFinalto Review 2026: Regulation, Trading Environment, and Platform Access
WikiFXMetaTrader 5 Expands Infrastructure With New Amsterdam Hosting for Backup Servers
WikiFXBaFin Issues Fresh Warnings Over Unauthorized Financial and Crypto Services
WikiFXRate Calc

