Gold Price, Silver Price Jump After Saudi Arabia Oil Field Attacks
Abstract:Gold and silver turned sharply higher after the weekend‘s drone attacks on Saudi oil fields saw tensions in the area ratchet higher with US President Donald Trump warning Iran that he is ’locked and loaded.
Gold (XAU) Price, Silver (XAG) Price Analysis and Chart
Gold rallies back over $1,500/oz. on safe-haven buying.
Silver lags gold for now but eyes $18.00/oz. again.
Q3 2019 Gold Forecast and Top Trading Opportunities
Gold Boosted by Traditional Safe-Haven Bid
News that Saudi oil fields had been attacked by drones on Saturday - with Iran being heavily implicated – sent gold higher at the start of the week and back above $1,500/oz. Gold‘s safe-haven appeal saw buyers return after President Trump warned Iran, who the US blame for the attack, that they were ’locked and loaded‘ while Iran warned the US that they were ’ready for a fully-fledged war. Tensions in the region were already high over the collapse of the Tehran nuclear deal, and this recent attack is likely to keep gold bid in the short- to medium-term.
Having traded around $1,512/oz., the precious metal has dipped back to $1,504/oz. and should remain bid around these levels going into this weeks main event, the FOMC meeting this Wednesday. The Fed is fully expected to cut interest rates again by 25 basis points and the post-FOMC press conference will see the central bank give further clues to the strength of the US economy.
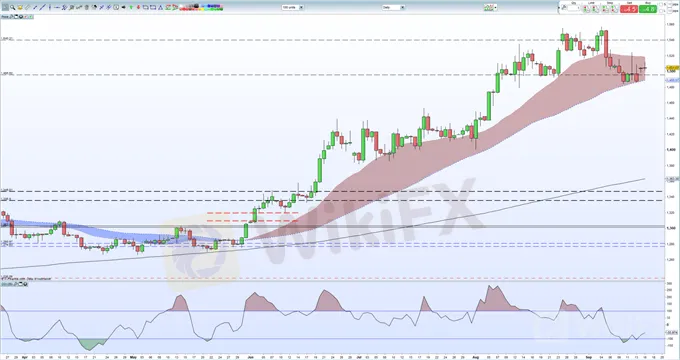
Gold is likely to re-test recent highs between $1,515/oz. and $1,528/oz ahead of the Fed but is unlikely to break higher until Fed chair Powell has spoken. To the downside there is strong support around $1,484/oz. and this is unlikely to come under pressure if US-Iran tensions remain.
Gold Price Daily Chart (March – September 16, 2019)

IG Client Sentiment data show that 71.7% of retail traders are net-long of gold, a bearish contrarian indicator. However, recent daily and weekly positional changes give us a stronger bearish contrarian trading bias.
How to Trade Gold: Top Gold Trading Strategies and Tips
Silver Turns Higher
Silver followed gold higher at the open and looks to re-claim $18.00/oz. in the short-term before the September 12 high at $18,47/oz. comes into view. To the downside, the $17.42 - $17.52/oz. area should provide a decent level of support. The gold/silver ratio is currently 84.00 after having tightened to around 82.00 last week.
Silver Daily Price Chart (January – September 16, 2019)

Read more

Gold Price Forecast
Bears waiting to target $1,700.

Gold Price Update
Gold Down, Investors Await Further Inflation Data

EURUSD Fails to Test 2019 Low, RSI Flashes Bullish Signal After ECB
EURUSD fails to test the 2019-low (1.0926) following the ECB meeting, with the Relative Strength Index (RSI) breaking out of the bearish formation carried over from June.

USDCAD Rebound to Benefit from Sticky US Consumer Price Index (CPI)
Updates to the US Consumer Price Index (CPI) may keep USDCAD afloat as the figures are anticipated to highlight sticky inflation.
WikiFX Broker
Latest News
RM668K Gone Overnight: Factory Supervisor Trapped in Fake Investment Scam
IVY MARKETS Exposure: Traders Allege Illegitimate Fees, Blocked Withdrawal Orders & No Refunds
From a Small Exchange to a Global Money-Laundering Case: The True Story of a Man Named “Vinnik”
Year of the Horse(2026): Which Zodiac Signs Will Excel Financially?
Rate Calc
