Silver Price Forecast
Abstract:Silver price is heading back to August low?
Silver prices are now approaching their worst performance since June 17, which preceded a one-month long sideways move before another drop lower. These are ominous signs for silver prices.
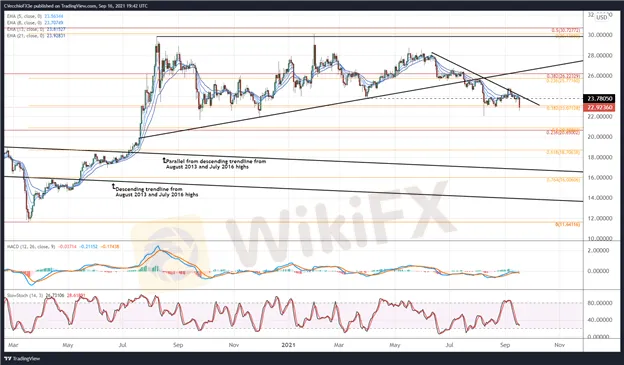
SILVER PRICE TECHNICAL ANALYSIS: DAILY CHART
At the start of September, silver prices were making an attempt to climb through the descending trendline from its summer swing highs, but a false bullish breakout materialized. The latest drop in silver prices has seen a return to the 38.2% Fibonacci retracement of the 2020 low/2021 high range at 23.0713, setting up the potential for its lowest close of the year.
Silver prices are falling below their daily 5-, 8-, 13-, and 21-EMA envelope, which is quickly aligning in bearish sequential order. Daily MACD is trending lower while below its signal line, while daily Slow Stochastics are slumping back towards oversold territory. A return to the August low at 22.1020 appears likely in the near-term.

SILVER PRICE TECHNICAL ANALYSIS: WEEKLY CHART
In early-August, it was noted that “failure to return into the ascending triangle this week would increase the likelihood of a deeper setback, potentially as far as the 23.6% Fibonacci retracement of the 2011 high/2020 low range at 20.6500.” A loss of the August low at 22.1020 would increase the odds of a return to the 23.6% Fibonacci retracement.

Read more

【MACRO Alert】Is silver poised to take the top spot? Is the driving force behind it once again ‘Made in China’?
During the minute from 21:12 to 21:13 Beijing time on May 28th, the most active COMEX silver futures contract traded 707 contracts, with a total value of $114 million. Spot silver briefly exceeded $32 per ounce for the first time since May 22nd, before slightly pulling back to around $0.5.

Can Silver break its trading range?
Silver has rejected prices lower than $21.5 and higher than ~$30.0 for more than a year.

Silver Price Breakout Begins as US Treasury Yields Drop to Multi-year Lows
An environment defined by plummeting US Treasury yields and a weak US Dollar has historically been very bullish for silver prices.
WikiFX Broker
Latest News
Spotting Red Flags: The Ultimate Guide to Dodging WhatsApp & Telegram Stock Scams
WikiFX Review: Why so many complaints against QUOTEX?
Trans X Markets: Licensed Broker or a Scam?
Judge halts Trump\s government worker buyout plan: US media
BaFin Unveils Report: The 6 Biggest Risks You Need to Know
IMF Warns Japan of Spillover Risks from Global Market Volatility
Beware of Comments from the Fed's Number Two Official
RBI: India\s central bank slashes rates after five years
Nomura Holdings Ex-Employee Arrested in Fraud Scandal
Pepperstone Partners with Aston Martin Aramco F1 Team for 2025
Rate Calc

