Top Forex Chart Patterns Every Trader Must Know

Abstract:Unlock the power of forex chart patterns! Learn how to spot trends, avoid common mistakes, and use triangles, head and shoulders, and flags to maximize profits.
The foreign exchange (forex) market is a vast, high-stakes environment where currency values constantly fluctuate based on economic factors, news events, and market sentiment. One of the essential tools that forex traders use to interpret the complex dynamics of the market is technical analysis, which often includes chart patterns. Chart patterns are visual representations of price movements that help traders predict future market behavior.
This article delves into the top forex chart patterns every trader must know. By understanding these patterns and learning how to read them, traders can enhance their strategies, identify profitable opportunities, and minimize risk. We will explore how these patterns show market movements, how trader psychology influences pattern formation, common mistakes traders make, and how to effectively spot profit signals using chart patterns. Additionally, we will look at how to set stops and targets to manage risk effectively.
How Forex Chart Patterns Show Market Ups and Downs
Chart patterns are not just random formations; they are the result of supply and demand forces at play in the market. By interpreting these patterns, traders can gauge whether the market is in an uptrend, a downtrend, or consolidating. Recognizing these market conditions early can help traders make informed decisions about when to enter or exit trades.
Types of Forex Chart Patterns
- Continuation Patterns
Continuation patterns signal that the current trend will continue after a brief consolidation or pullback. These patterns are crucial for traders who wish to stay with the prevailing trend.
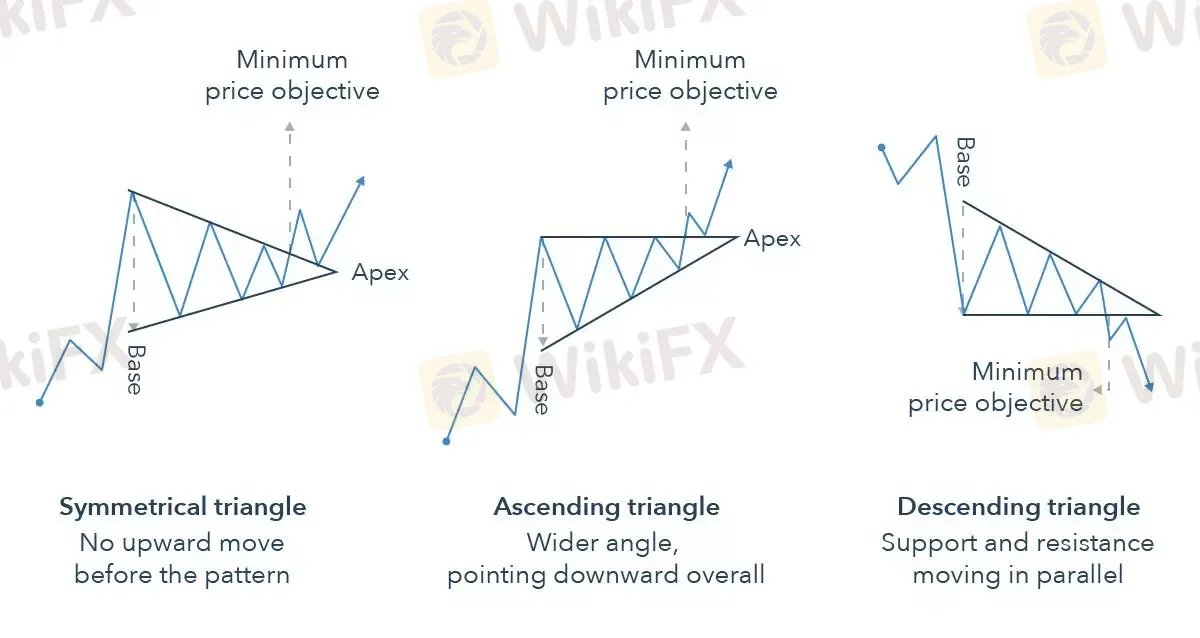
- Triangles: Triangles are one of the most widely recognized continuation patterns in forex trading. These patterns form when price action narrows within converging trendlines. There are three types of triangles:
- Ascending Triangle: This pattern forms when there is a horizontal resistance level and an upward-sloping support line. The price approaches the resistance level repeatedly, suggesting that the uptrend will continue after the breakout.
- Descending Triangle: This pattern forms with a horizontal support level and a downward-sloping resistance line. It typically occurs in a downtrend, indicating that the price is likely to break downward after the breakout.
- Symmetrical Triangle: The symmetrical triangle is a neutral pattern that forms during periods of indecision. It occurs when the market moves within narrowing highs and lows. A breakout from the pattern can signal either a continuation of the existing trend or a new trend in the opposite direction, depending on the breakout direction.
- Flags and Pennants: These patterns are formed after a strong price movement and represent brief consolidations before the trend resumes. Flags are rectangular-shaped and slope against the prevailing trend, while pennants are small triangles. Both flags and pennants are typically short-term patterns and serve as continuation signals, with traders looking for breakouts to confirm the trend continuation.
- Reversal Patterns
Reversal patterns indicate a potential change in the prevailing market trend. These patterns are especially valuable when traders anticipate a market reversal, whether it be from bullish to bearish or vice versa.
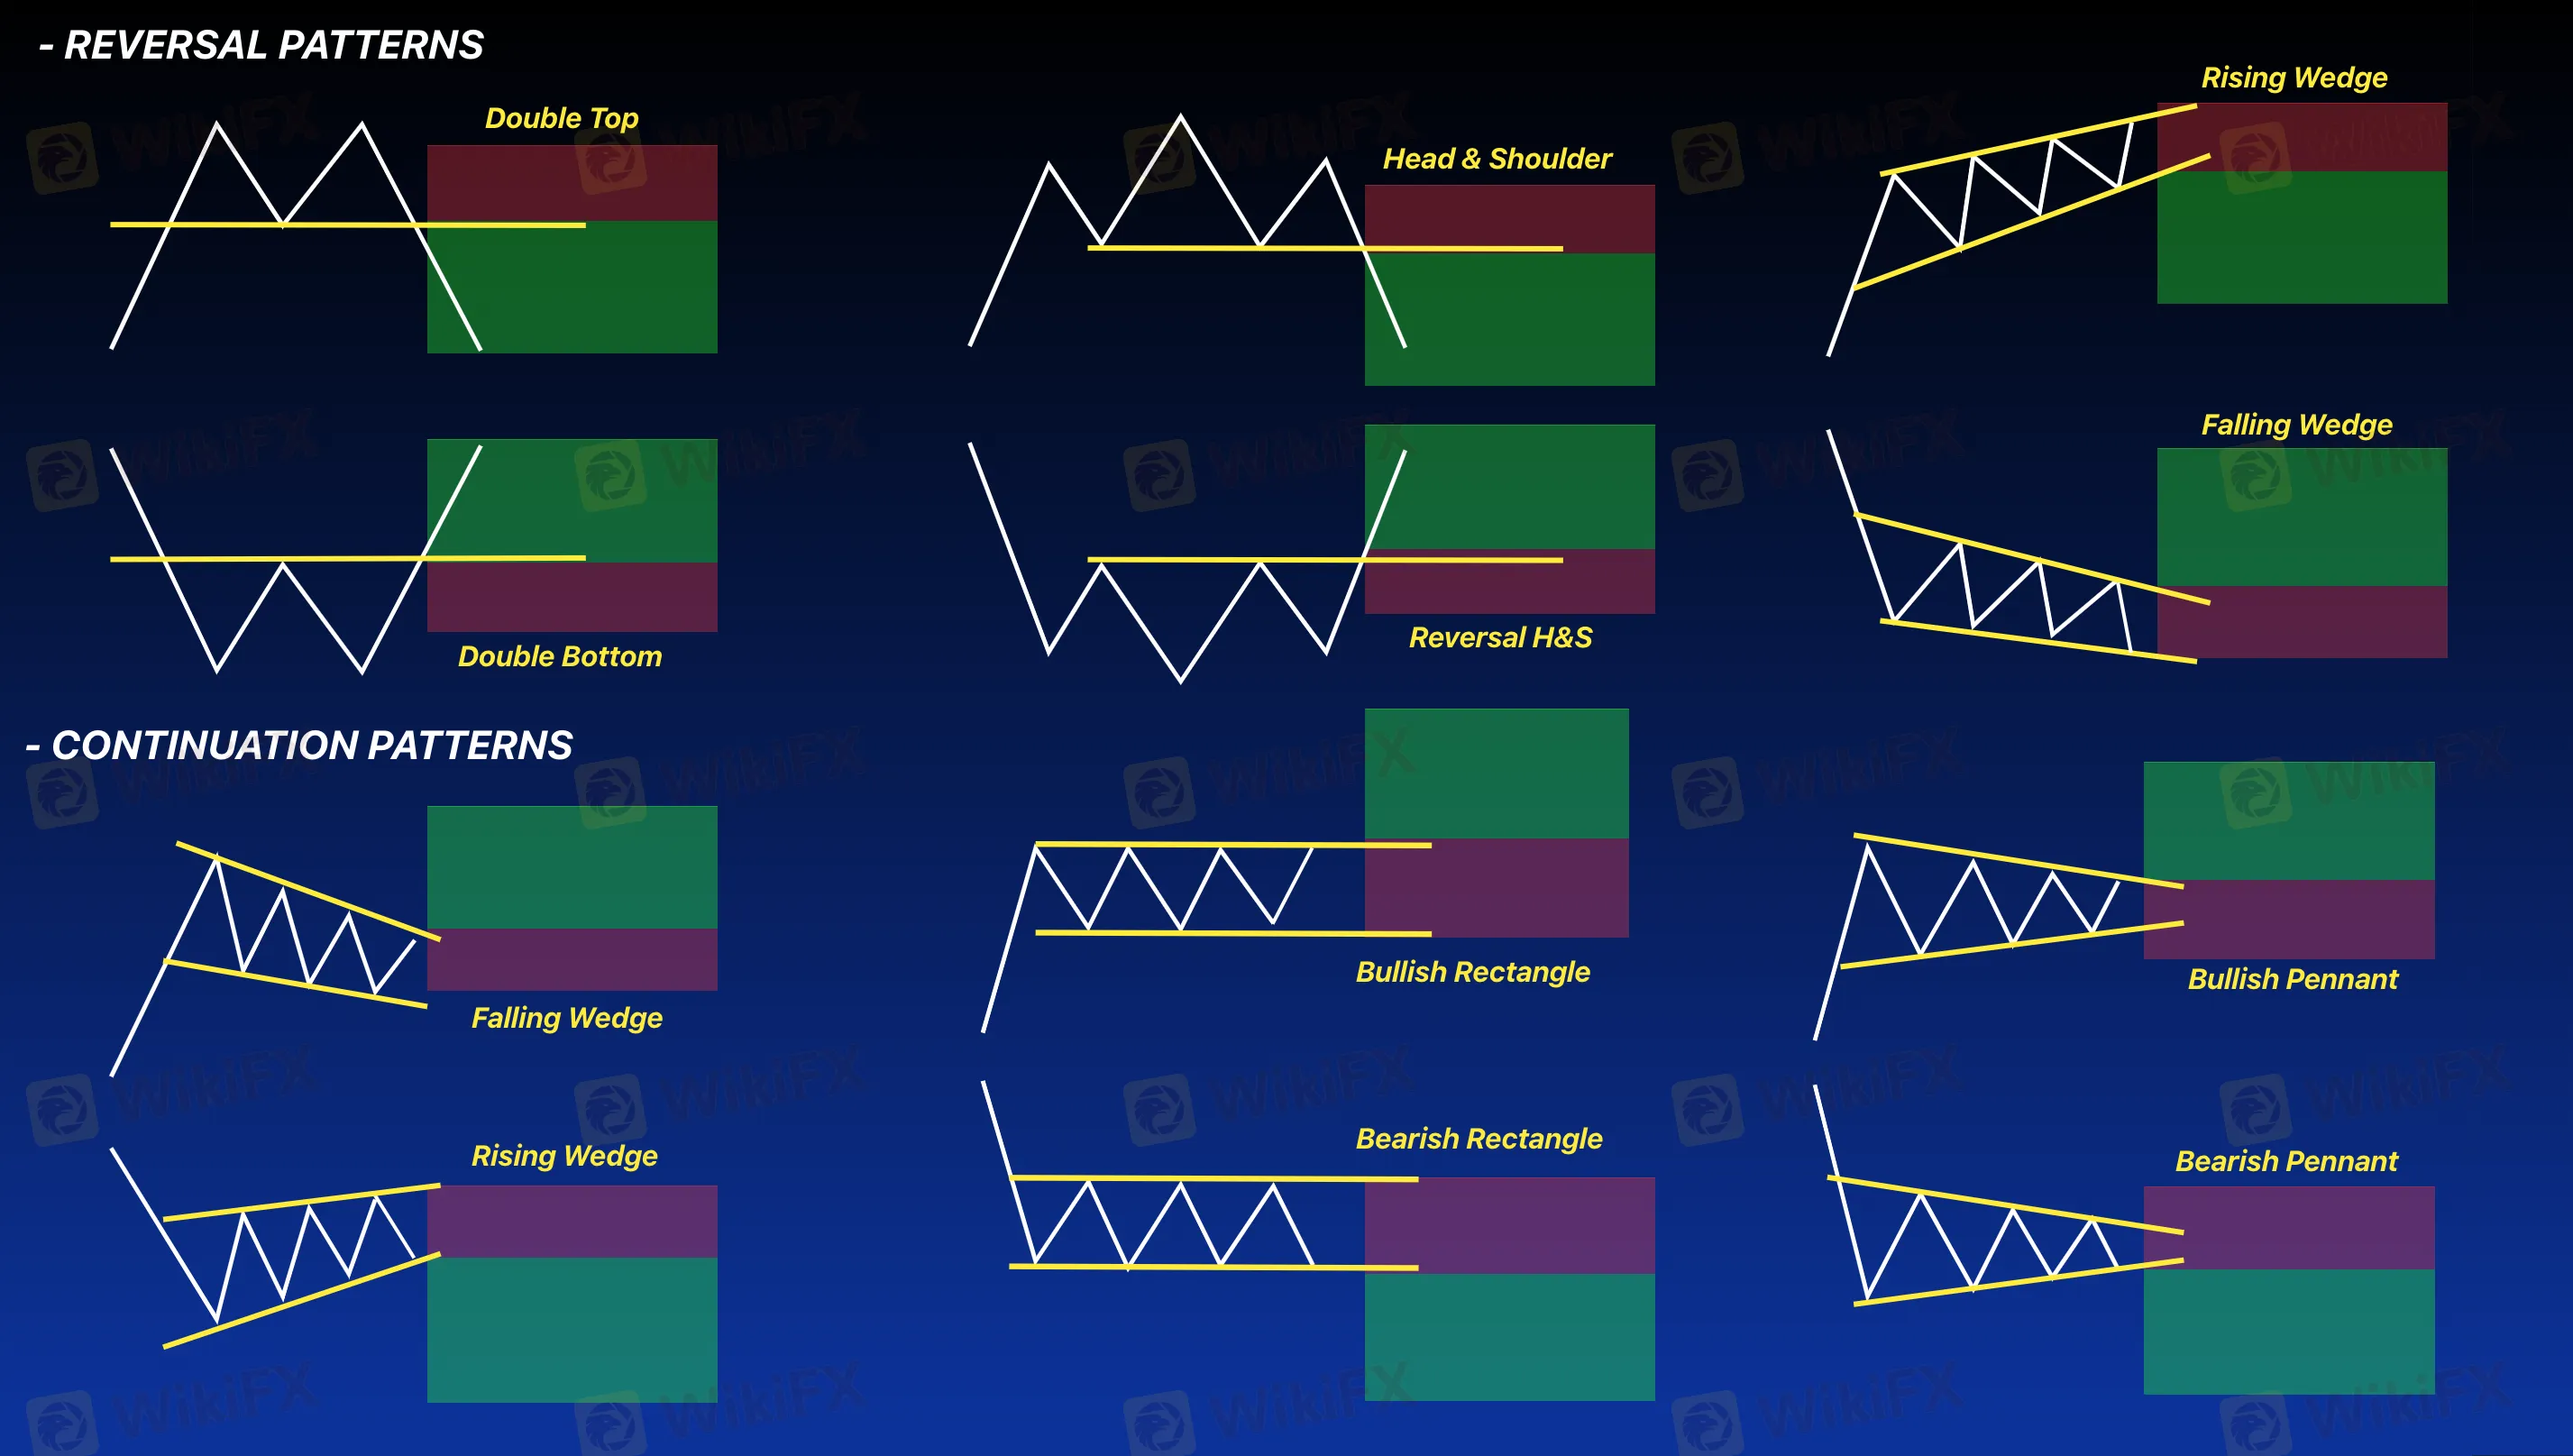
- Head and Shoulders: One of the most reliable and recognized reversal patterns, the head and shoulders pattern forms when a market is in an uptrend. It consists of three peaks: the first and third peaks (shoulders) are smaller than the second peak (head). The pattern is confirmed when the price breaks below the neckline after the right shoulder. This breakdown suggests a reversal from a bullish to a bearish trend. The inverse head and shoulders pattern works similarly but signals a reversal from bearish to bullish.
- Double Top and Double Bottom: A double top is a bearish reversal pattern that forms after a prolonged uptrend. It appears as two peaks at roughly the same level. The price tests the previous high but fails to break through, signaling that the upward momentum is weakening. Once the price breaks below the support level formed between the two peaks, it signals a downward reversal. Conversely, the double bottom is a bullish reversal pattern that forms in a downtrend. It appears as two troughs at roughly the same level, signaling that the downward momentum is losing steam. A breakout above the resistance level confirms the reversal to the upside.
- Triple Top and Triple Bottom: These patterns are similar to double tops and bottoms but involve three peaks or troughs. A triple top indicates a bearish reversal, while a triple bottom signals a bullish reversal. These patterns tend to be more reliable than double tops and bottoms, as they take more time to form and require more market participants to be involved in the price action.
- Other Important Patterns
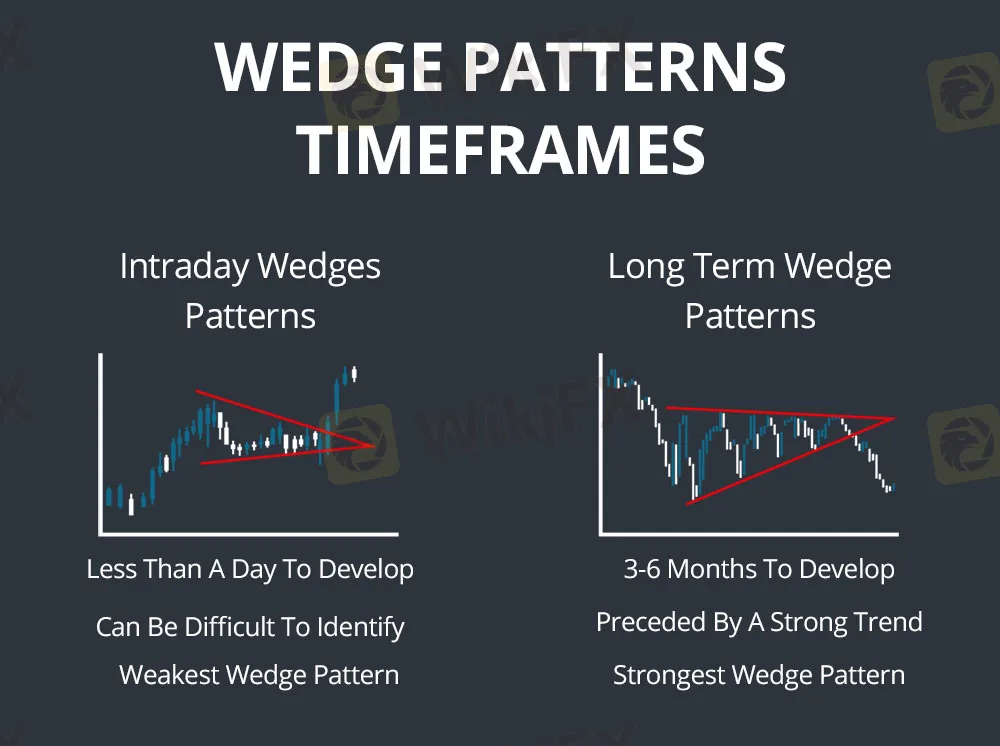
- Wedges: Wedge patterns are similar to triangles but occur in a longer time frame and involve a more pronounced narrowing of price action. Rising wedges form in uptrends and typically signal a reversal to the downside, while falling wedges form in downtrends and signal a potential reversal to the upside.
- Rectangle Patterns: Rectangles are horizontal consolidation zones where the price moves between parallel support and resistance levels. These patterns indicate indecision in the market. When the price breaks above or below the rectangles boundaries, it typically signals the continuation of the trend in that direction.
Trader Psychology in Forex Chart Patterns
The formation of chart patterns is driven by the collective behavior of traders, and trader psychology plays a significant role in how these patterns emerge. By understanding the emotions that influence market decisions, traders can improve their ability to read chart patterns and make better decisions.
Fear and Greed
Fear and greed are the primary emotions that shape price movements in the forex market. Fear can cause traders to exit their positions prematurely, especially when the market moves against them. Conversely, greed can lead traders to take excessive risks, such as entering trades at unfavorable levels or holding onto positions for too long in the hope of greater profits.
For example, in the case of a double top, greed may push the price higher, forming the second peak, but once traders realize the market is turning, fear sets in, causing a sharp reversal and breaking the support level. Recognizing these emotional responses can help traders avoid acting impulsively and make more rational decisions.
Confirmation Bias
Traders often have a tendency to seek out chart patterns that confirm their pre-existing beliefs about the market. This confirmation bias can lead to misinterpretation of patterns, especially if a trader is looking for a particular signal that fits their narrative. To avoid this, traders should maintain objectivity when analyzing charts and confirm their observations with other technical indicators and market factors.
Patience and Discipline
Patience and discipline are essential traits for successful forex traders. Chart patterns often take time to develop, and traders must be patient before acting on the signals they provide. Entering a trade too early can lead to false breakouts or missed opportunities. Similarly, traders must exercise discipline by sticking to their trading plan and avoiding emotional decision-making based on incomplete patterns.
Mistakes When Reading Forex Chart Patterns
Even experienced traders can make mistakes when interpreting chart patterns. Below are some common errors and how to avoid them:
- Relying on Patterns Alone
Chart patterns should be used in conjunction with other technical analysis tools. Traders who rely solely on chart patterns may miss important signals from other indicators like moving averages, RSI, or MACD. Combining multiple tools provides a more complete picture of the market.
- Ignoring Volume
Volume is a critical component of chart patterns. A pattern that forms without adequate volume is less likely to lead to a successful breakout. Volume confirms the strength of a price move, and traders should always look for volume spikes when trading chart patterns like triangles or head and shoulders.
- Entering Trades Prematurely
One of the biggest mistakes traders make is acting on a chart pattern before it‘s fully confirmed. A head and shoulders pattern, for example, isn’t complete until the price breaks the neckline. Rushing into a trade can lead to losses if the pattern turns out to be a false signal.
- Misjudging the Pattern's Reliability
Not all chart patterns are equally reliable. Patterns that form after a strong trend tend to be more reliable than those that form during periods of sideways movement or indecision. Understanding the context of the pattern is essential to assessing its reliability.
Spotting Profit Signals in Forex Chart Patterns
Recognizing profit signals in chart patterns can help traders enter trades at the optimal time. These signals can include breakouts, trend reversals, or momentum shifts, all of which provide valuable opportunities to profit in the forex market.
Breakouts and Trend Continuation
Breakouts signal the continuation of a trend, and identifying them early can lead to profitable trades. For example, when a price breaks out of a triangle or flag pattern, it often signals that the market is ready to continue in the direction of the previous trend. Traders can enter the market as soon as the breakout is confirmed, typically with a strong close outside the pattern and a surge in volume.
Setting Targets and Stops with Patterns
Using chart patterns to set stop-loss and take-profit levels is a key aspect of managing risk. For example, after a head and shoulders pattern, traders can set their stop-loss just above the right shoulder and their profit target by measuring the height of the head and projecting it downward from the neckline. Similarly, in a triangle pattern, traders can measure the height of the pattern and use it to set their profit target once the price breaks out.
Risk Management
Effective risk management is crucial when trading forex chart patterns. Traders should always set stop-loss orders to protect their capital in case the market moves against them. By using chart patterns to determine logical stop-loss placements and setting profit targets, traders can manage their risk effectively and maximize their potential for success.
Conclusion
Forex chart patterns are indispensable tools for traders who wish to succeed in the competitive and fast-paced world of currency trading. Understanding and interpreting these patterns allows traders to make informed decisions based on market conditions and trends. Whether youre using continuation patterns like triangles and flags, or reversal patterns like head and shoulders and double tops, chart patterns provide valuable insights into future price movements.
However, chart patterns should not be relied on in isolation. Successful forex trading requires a combination of technical analysis, trader psychology, discipline, and risk management. By recognizing common mistakes, avoiding emotional trading decisions, and using patterns in conjunction with other tools, traders can increase their chances of profitability and minimize risk.
Mastering forex chart patterns is a continuous learning process, and with the right knowledge and approach, traders can build successful trading strategies that take full advantage of the forex markets potential.

Read more

Is Forex Trading Halal or Haram? What Do Scholars Say?
For Islamic traders and investors, one of the most relevant and frequently asked questions is whether forex trading is halal (permissible) or haram (forbidden) in Islam? In this article, we will explore both sides of the debate. Keep reading to uncover the truth and make Informed & Faith-conscious decisions about your investments.

Top Forex Pairs for Scalping: Best Currency Choices Explained
Discover the best forex pairs for scalping in 2025. Learn which currency pairs offer top liquidity, tight spreads, and volatility for fast, profitable trades.

What Is a Forex Spread? Learn the Basics Now!
Learn what forex spreads are, how they impact your trading costs, and strategies to minimize them. Master bid-ask spreads with our complete 2025 guide.

Best Forex Trading Time in India: A Beginner’s Guide
Discover the best Forex trading times in India. Learn when to trade for optimal profit with our beginner’s guide to mastering the Forex market in India.
WikiFX Broker
Latest News
Fortrade: A Closer Look at Its Licenses
WikiFXFRAUD ALERT! Spanish Regulator, CNMV Exposed Scam Brokers
WikiFXEuro zone economy ekes out better-than-expected 0.1% growth in second quarter
WikiFXAdidas to raise prices as US tariffs cost €200m
WikiFXTop 4 Forex Scam Tactics Fake Brokers Use to Trap Investors
WikiFX10 Best MUST- READ Books on Forex Trading
WikiFXInefex: Mastering the Art of Duping Forex Investors
WikiFXCompanies from Stanley Black & Decker to Conagra are saying tariffs will cost them hundreds of millions
WikiFXTrump's tariffs could soon bring higher food prices for some Americans, analysis finds
WikiFXiFourX: So Many Red Flags You Can’t Ignore
WikiFXRate Calc
