Stock Indices Show Bearish Divergence - Week 31 | Technical Analysis by Jasper Lawler
Abstract:Weekly thoughtsAs I think we all know, stock indices have been rising A LOT. They have defied all bearish expectations brought about by tariffs and economic uncertainty. As usual markets have climbed
Weekly thoughts
As I think we all know, stock indices have been rising A LOT. They have defied all bearish expectations brought about by tariffs and economic uncertainty. As usual markets have 'climbed the wall of worry'.
There are always reasons to get spooked out of your trades.
This week were looking at some stock index CFDs. If you're buying stocks, there are always many experts forecasting they will drop and offering convincing explanations for why. Depending on your mentality, there are three ways to react to these bearish warnings.
Stay bullish no matter what
Be convinced by the bears and sell
Wait for real evidence that it's time to sell
Weekly charts have failed to break resistance
Weekly bearish engulfing candlesticks
RSI bearish divergence on daily charts
Setups & signals
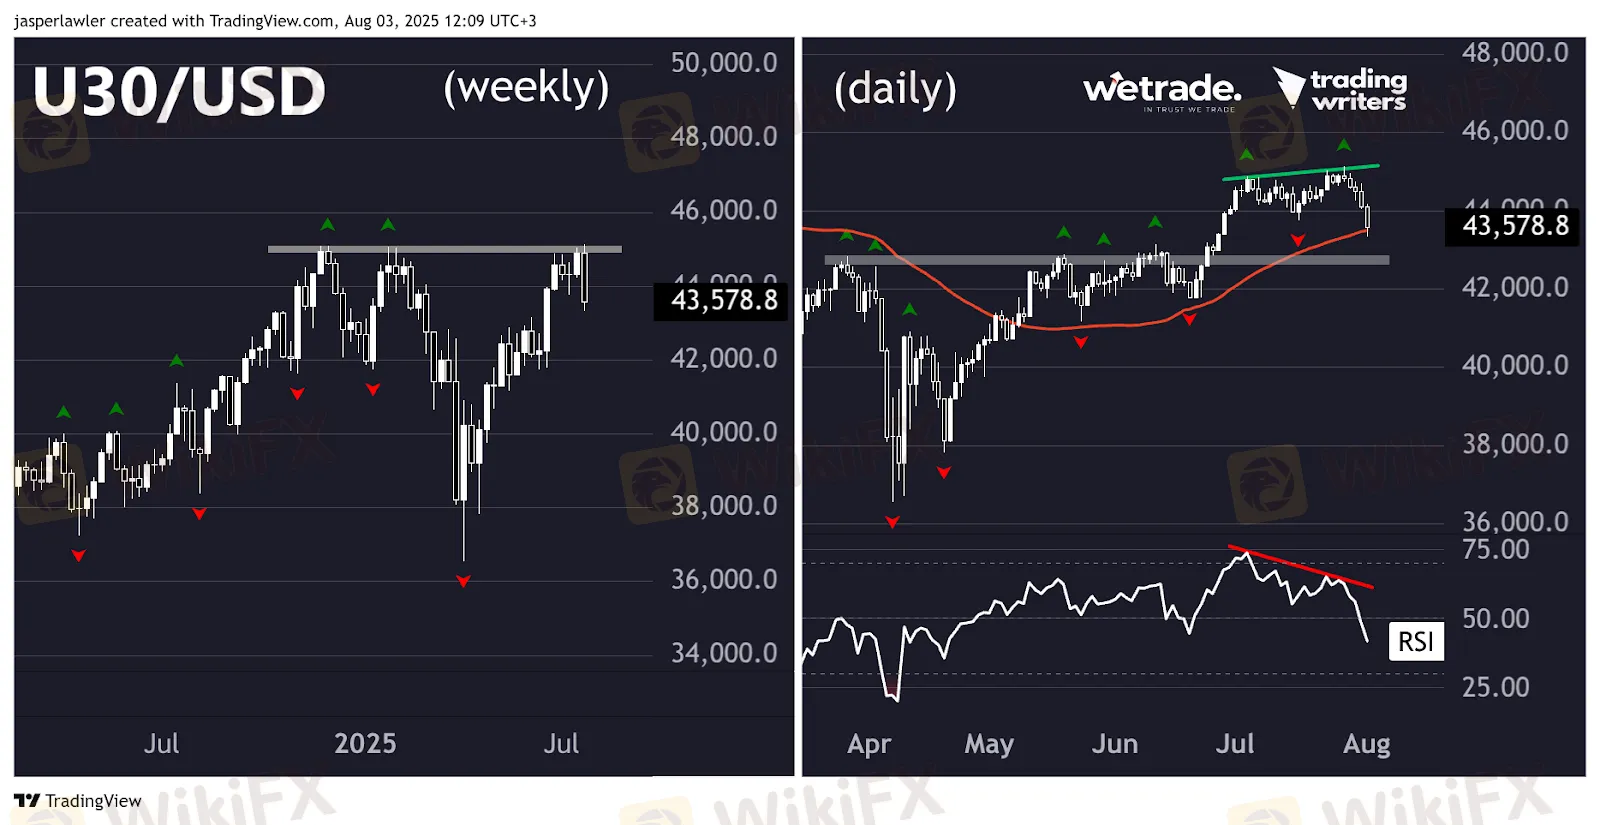
U30/USDSetup
Signal
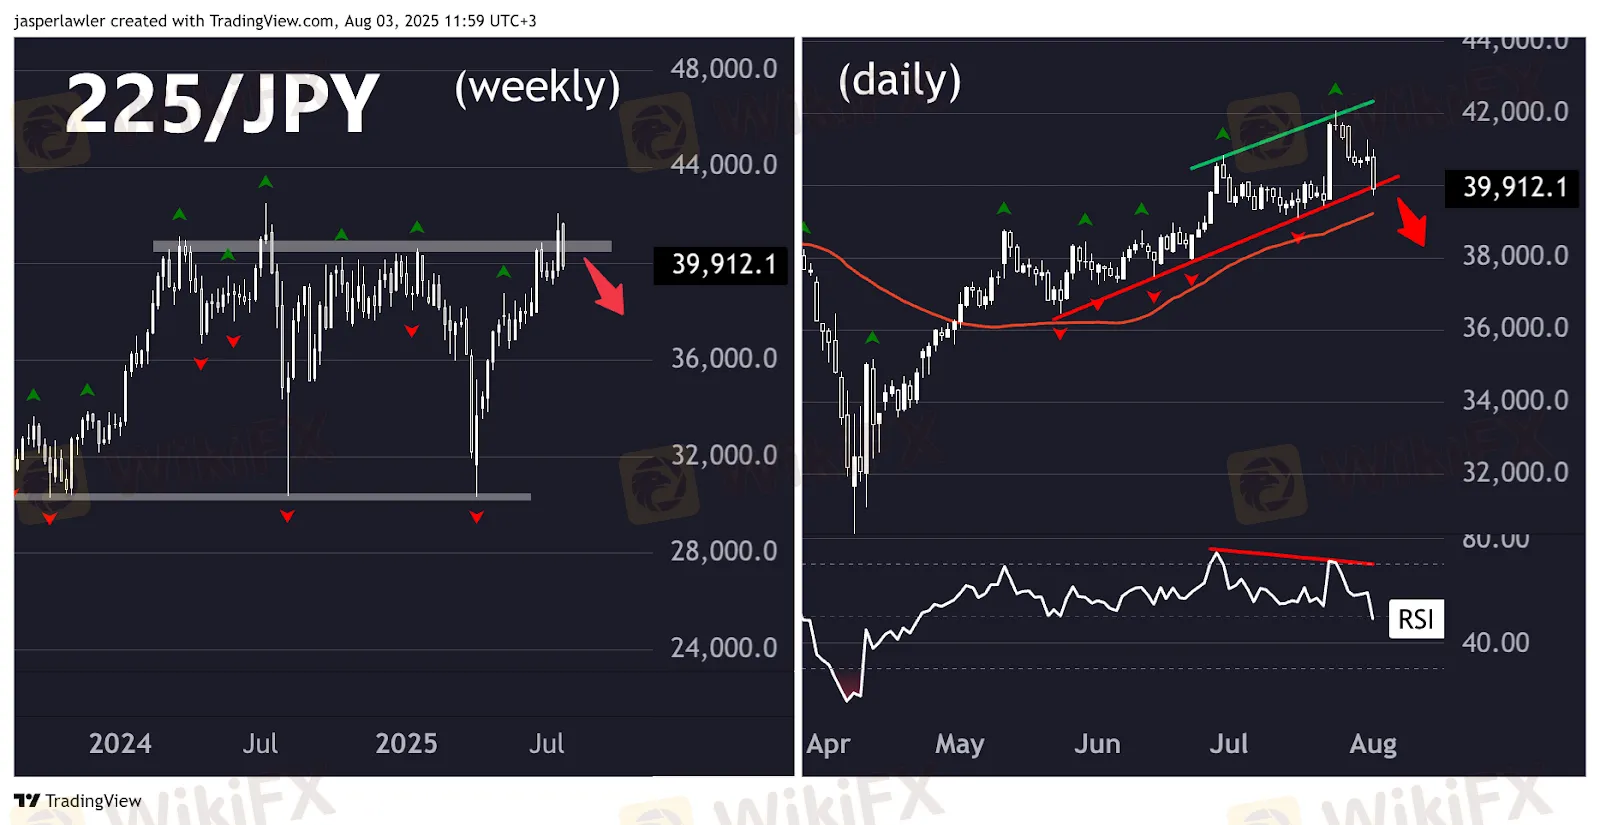
225/JPYSetup
Signal
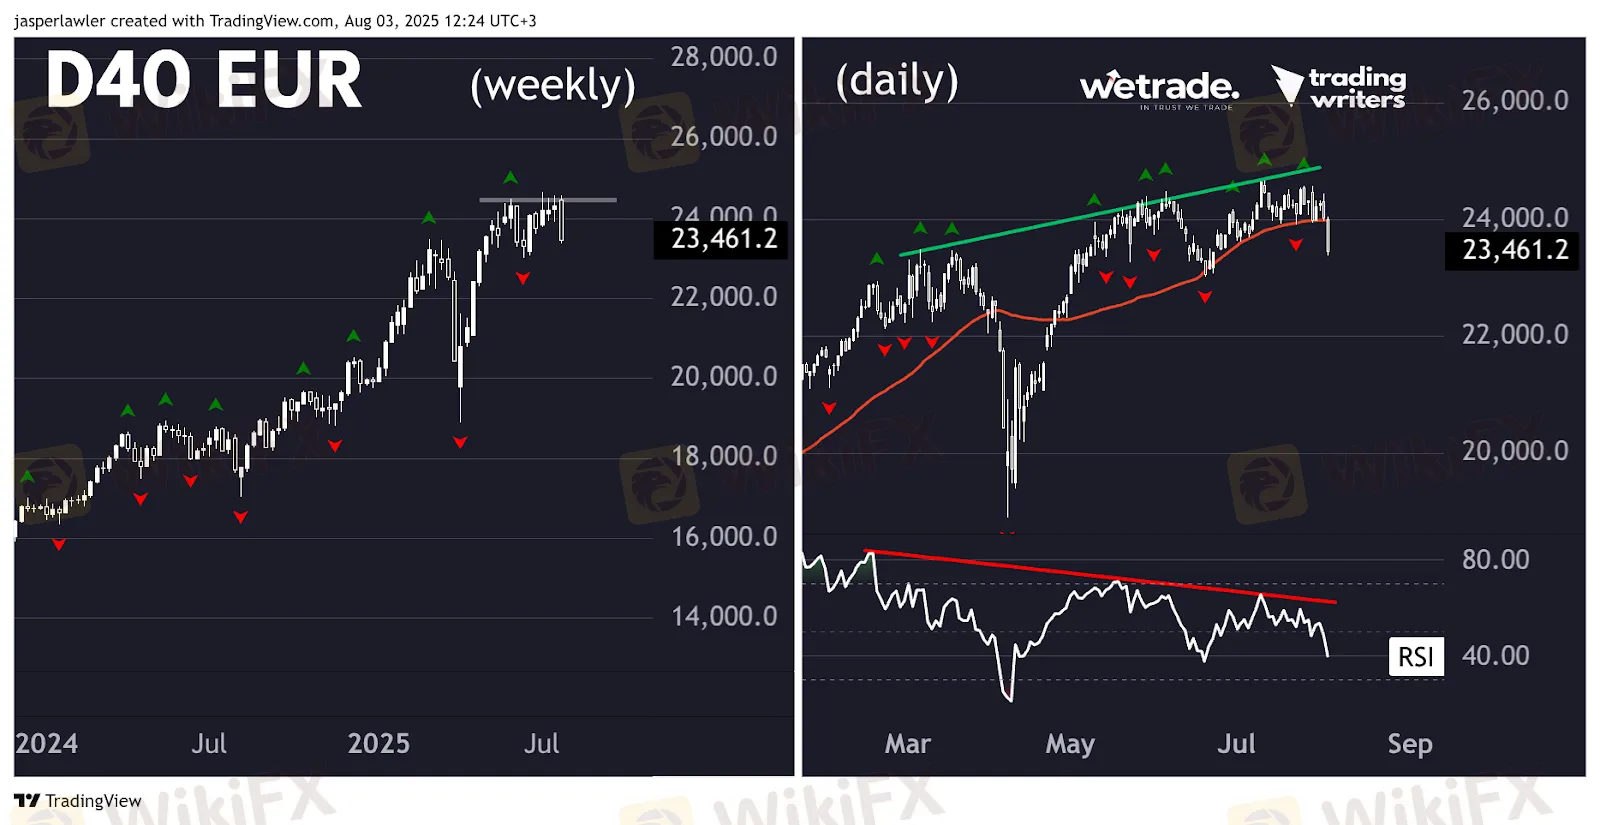
D40/EURSetup
Signal
Naturally, number three is what you should aim for each time.
It takes a lot for our team to want to sell during uptrends - we almost never do it. So let's talk about two pieces of evidence we look for to signal it might be time to sell some stocks - and perhaps even go short stock indices.
As a reminder you can do a 'naked' short position using CFDs in indices - just like you would in any other CFD trade. Or if you have a long term portfolio of stocks you can ‘hedge’ the long position of your portfolio with some tactical short positions in indices if you think the market has gone up a lot and is due a correction.
As a general rule, when you see similar matching signals across various related markets - it gives the signal more power.
There are three overlapping signals weve seen in stock indices that suggest to us it's time to be more cautious around the stock markets.
Lets explain these ideas a little before we look at our three specific setups and signal this week.
1. Weekly Charts Have Failed to Break Resistance
When price retests a previous high and fails to break through, its a sign of hesitation. That hesitation, especially at a major level, can signal exhaustion. Several stock indices have recently stalled near weekly highs—enough reason to be cautious.
2. Weekly Bearish Engulfing Candlesticks
Candlestick patterns arent foolproof, but they show shifts in sentiment. A bearish engulfing candle – where a red candle fully engulfs the previous green one – suggests sellers have taken control. Seeing this on weekly charts, especially at resistance, strengthens the case that a short-term top might be forming.
3. RSI Bearish Divergence on Daily Charts
This is about fading momentum. When price makes a higher high but RSI makes a lower high, its a warning sign. It means the move lacks conviction. One divergence is a yellow light – but when it lines up with failed resistance breaks and bearish candles, it becomes much more meaningful.
Putting It Together
Each of these signals on their own may not justify action, but combined – and showing up across several indices – they suggest it could be time to tighten stops, reduce long exposure, or consider tactical shorts.
BUT..
As always, we could be completely wrong! This analysis IMHO is not ‘wrong’ but the price can always do something different to what the analysis suggests. This is no reason to be ‘trigger shy’ it's a reason to stay nimble.
Its entirely possible that the price attempts to break lower as some traders sell near the old highs but then buyers step back in again on the dip. If the bearish signals fail - that in itself is a bullish signal - and time to look to go long again.
We review hundreds of charts weekly and present three of our favourite setups and signals.
Price has made a bearish engulfing candlestick, which has engulfed the prior 4 weeks, adding weight to the pattern. The pattern has occurred at prior resistance formed by the old record high.
Price remains above its 50 day SMA in what could be a simple ‘buy the dip’ scenario. However, a break of the prior low as well as bearish RSI divergence, including the move back under the 50 RSI level suggest weakness and a lower likelihood of any bounce taking out the prior daily high.
Here the price has made a ‘fakeout’ above the 40,000 round number but closed back below it the following week, indicating a lack of bullish follow-through.
Price has pulled back to a rising trendline and remains above its rising 50 DMA. However, there is some bearish RSI divergence, including RSI falling to its lowest since April. Again there is a possibility to buy the dip after a few days of weakness in an uptrend but there are some bearish signals.
The price action in D40 is more bullish than that of U30 or 225. However, there has again been a bearish engulfing candlestick formed after a successful test of the prior record high.
Price has dropped under its 50 DMA in a continuation of the consolidation around the 24,000 level. Bearish RSI divergence across the last three major peaks indicates soft momentum and scope for a deeper pullback.
But that's just how the team and I are seeing things, what do you think?

WikiFX Broker
Latest News
Belgium’s FSMA Flags 25 Fraudulent Trading Platforms
 WikiFX
EPFX Review 2026: Should You Trade with This Broker?
WikiFXCash Trust Scheme Cost 1,800 Victims More Than RM100 Million
WikiFXChinese Tycoon Guo Wengui Gets 30 Years in US Prison for $1 Billion Fraud Scheme
WikiFXTHEFALCON MARKETS Review 2026: Is This Forex Broker Safe?
WikiFXACY Securities Review: Regulation Warnings, Withdrawal Pain, and Broker Risk Signals
WikiFXTrading Pro Review: Withdrawal Complaints, FCA Warning, and Broker Risk Exposed
WikiFXNinja Trader Review 2026: Should You Trade with This Broker?
WikiFXWhy Slippage Explodes Your Stop Loss During Data Releases and Rollovers
WikiFXHow Long Does Your Buy Limit Last? Understanding Time in Force Settings
WikiFXRate Calc

