Trump Rallies Again, Risk Assets Stage Strong Rebound
Abstract:Unlike his predecessors, Donald Trumps personality is notably more flamboyant and ambitious. His influence not only triggers short-term volatility in capital markets, but his core policy agenda also f
Unlike his predecessors, Donald Trumps personality is notably more flamboyant and ambitious. His influence not only triggers short-term volatility in capital markets, but his core policy agenda also focuses on reindustrializing America, seeking to address structural trade and fiscal deficits, and stimulating private investment.
Since his return to office in April, we‘ve seen Trump face some turbulence in implementing his policy vision. Still, he has conveyed an important message of confidence: if the direction is clear, the length of the road should not be feared. Regardless of one’s personal opinion of Trump, his mindset offers investors a worthy lesson in conviction.
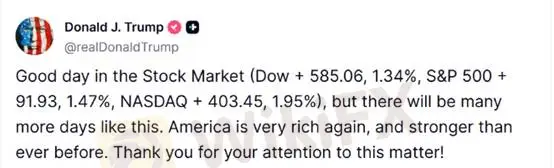
(Chart 1: Trump asserts “The good days are far from over”; Source: Truth Social)
Last weeks nonfarm payrolls report shocked markets, pushing expectations for a September rate cut to 95%, with full-year expectations now at three cuts. This drove the U.S. 10-year Treasury yield below 4.2%, while gold regained the $3,380/oz level. Market sentiment now centers on the upcoming Federal Reserve Board appointments, with expectations that continued accommodative policy will keep U.S. equities well-supported.
Indeed, if the Treasury is to issue debt smoothly, funding costs will depend on the Fed helping to reduce the governments interest burden.
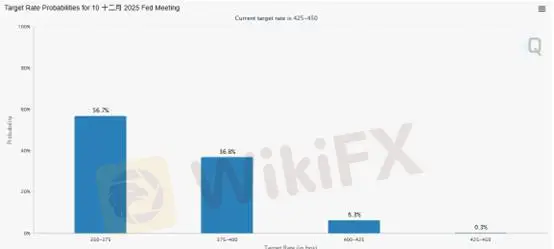
(Chart 2: 2025 full-year rate cut expectations — 3 cuts priced in; Source: FedWatch)
Turning to leading economic indicators, the ISM Manufacturing PMI came in at 48.0, below the prior reading of 49.0, indicating continued contraction in the manufacturing sector. However, the details hint at stability within the slowdown.
Breakdown of Key Components:
New Orders: 46.4 → 47.1 (up 0.7%)
Production: 50.3 → 51.4 (up 1.1%)
Employment: 45.0 → 43.4 (down 1.6%)
Supplier Deliveries: 54.2 → 49.3 (down 4.9%, falling below the expansion/contraction threshold)
Inventories: 49.2 → 48.9 (down 0.3%)
The state of manufacturing activity is best reflected in employment and supplier delivery data. While the sector remains in contraction, shorter supplier delivery times bode well for lower input costs. The prices-paid index dropped from 69.7 to 64.8, down 4.9%.
On the demand side, conditions have improved slightly from last month. New and backlogged orders have increased, while inventories and customer inventories have fallen. Coupled with pre-tariff front-loading of shipments, Julys manufacturing managers still show an intent to restock.
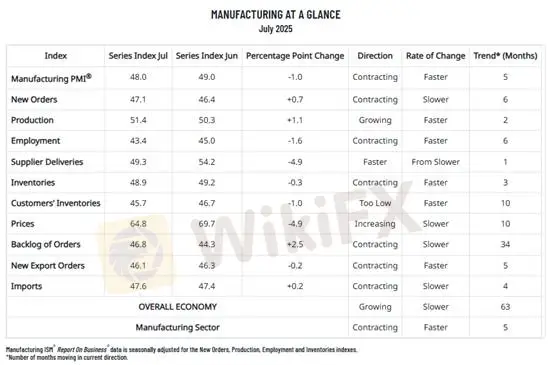
(Chart 3: U.S. July ISM Manufacturing PMI; Source: ISM Report)
For U.S. manufacturing to truly strengthen, clarity on tariffs and a shift toward looser monetary policy remain essential. While short-term headwinds from weak end demand persist, a stable third quarter could set the stage for holiday shopping season demand to serve as the next catalyst for consumer spending.
Although end demand is soft, AI-related capital expenditures remain robust. The divergence in economic momentum will likely drive differentiated performance across capital markets. All four major cloud service providers (CSPs) have reported earnings, and none have suspended 2025 capex plans. Guidance for 2026 points to even greater investment. This supports the Philadelphia Semiconductor Index and Nasdaq tech stocks, providing a strong floor for U.S. equity indices. In this context of weak end demand, downside potential in major indices may be limited.
Gold Outlook
Gold continues to climb in line with market expectations for rate cuts. Our primary focus remains on whether the U.S. dollar can maintain strong upward momentum, as this will guide the outlook for non-USD currencies and gold.
Technical Analysis of Gold
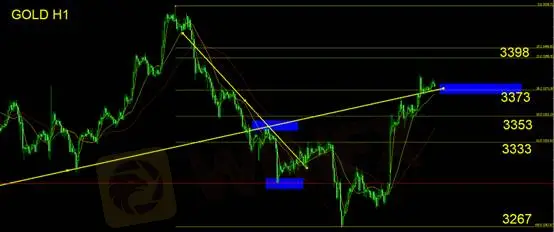
Gold prices have broken above the Fibonacci 61.8% resistance level at $3,373. However, hourly candlestick charts suggest investors should be wary of a possible false breakout. By rule of thumb, if $3,373 fails to hold, the daily candle is likely to close bearish, increasing the probability of a reversal.
Trading Plan for Today:
If yesterdays high at $3,385–$3,386 is not breached, the move should still be considered a rebound within a range. The price is likely to oscillate between $3,353 and $3,373. Conservative traders may stay on the sidelines until a confirmed daily reversal candle forms before initiating short positions. Aggressive traders may short intraday, exiting if price breaks above $3,390, and re-entering after testing the Fibonacci 23.6% resistance.
Support Levels: 3,373 / 3,353 / 3,333 / 3,267
Resistance Level: 3,398
Risk Disclaimer: The above views, analysis, research, prices, or other information are provided solely as general market commentary. They do not represent the official position of the platform. All viewers assume full responsibility for their own trading decisions. Please trade prudently.

WikiFX Broker
Latest News
Belgium’s FSMA Flags 25 Fraudulent Trading Platforms
 WikiFX
EPFX Review 2026: Should You Trade with This Broker?
WikiFXCash Trust Scheme Cost 1,800 Victims More Than RM100 Million
WikiFXChinese Tycoon Guo Wengui Gets 30 Years in US Prison for $1 Billion Fraud Scheme
WikiFXTHEFALCON MARKETS Review 2026: Is This Forex Broker Safe?
WikiFXACY Securities Review: Regulation Warnings, Withdrawal Pain, and Broker Risk Signals
WikiFXTrading Pro Review: Withdrawal Complaints, FCA Warning, and Broker Risk Exposed
WikiFXNinja Trader Review 2026: Should You Trade with This Broker?
WikiFXWhy Slippage Explodes Your Stop Loss During Data Releases and Rollovers
WikiFXHow Long Does Your Buy Limit Last? Understanding Time in Force Settings
WikiFXRate Calc

