Trading Oscillators: The Secret Tool Every Trader Should Know

Abstract:If you’ve ever looked at a trading chart and wondered how traders know when a price is “too high” or “too low,” the answer often lies in trading oscillators. A trading oscillator is a type of technical indicator that helps traders measure the momentum of price movements. In simple terms, it tells you when a currency pair, stock, or commodity might be overbought or oversold — which can signal a potential reversal.
What Are Trading Oscillators?
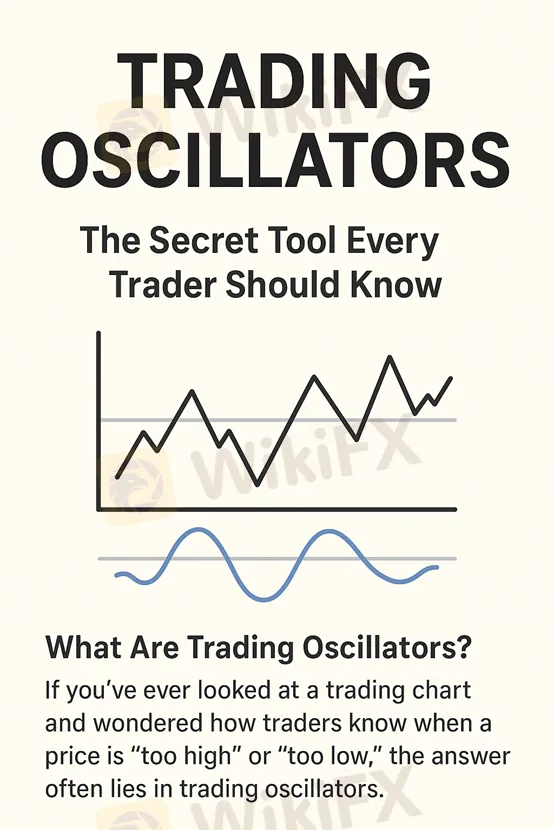
If youve ever looked at a trading chart and wondered how traders know when a price is “too high” or “too low,” the answer often lies in trading oscillators.
A trading oscillator is a type of technical indicator that helps traders measure the momentum of price movements. In simple terms, it tells you when a currency pair, stock, or commodity might be overbought or oversold — which can signal a potential reversal.
Oscillators “oscillate” (move back and forth) between two levels, often 0 to 100, helping traders visualize when the market might change direction.
Why Trading Oscillators Matter
For new traders, its easy to get lost in complex charts. But oscillators simplify decision-making by providing clear visual cues.
Here‘s why they’re useful:
- They help you spot trend reversals early.
- They can confirm whether a trend is strong or losing steam.
- They reduce emotional trading by giving objective signals.
When used correctly, trading oscillators can strengthen your trading strategy and improve timing for entry and exit points.
Popular Types of Trading Oscillators
Relative Strength Index (RSI)
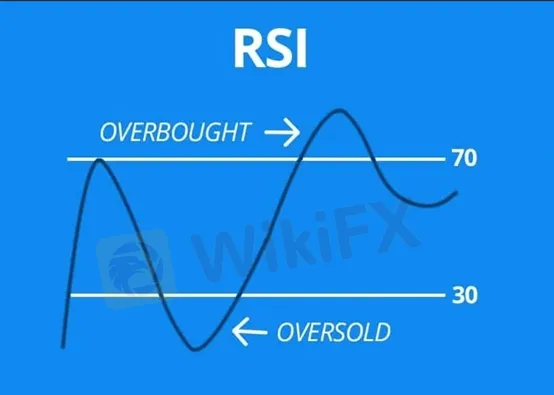
The RSI is one of the most popular oscillators. It ranges from 0 to 100:
- Above 70 → the market may be overbought (price could drop soon).
- Below 30 → the market may be oversold (price could rise soon).
RSI helps traders spot momentum shifts before the price reacts.
Moving Average Convergence Divergence (MACD)
The MACD is another widely used momentum trading tool. It shows the relationship between two moving averages of price.
When the MACD line crosses above the signal line, its often a buy signal.
When it crosses below, it can be a sell signal.
MACD works great for confirming the direction of a trend.
Stochastic Oscillator
This oscillator compares a securitys closing price to its price range over a set period. Like RSI, it helps identify overbought and oversold conditions, often using 80 and 20 as thresholds.
How to Use Trading Oscillators Wisely
Combine with trend analysis.
Dont rely only on oscillators — pair them with tools like moving averages to confirm signals.
Avoid false signals.
In a strong trend, oscillators can stay overbought or oversold for a long time. Wait for confirmation before trading.
Adjust settings.
Shorter periods make the oscillator react faster but can cause more noise; longer periods smooth out signals but may delay entry.
Conclusion
Trading oscillators are essential tools for traders who want to understand market momentum without diving into overly complex analysis.
For beginners, learning to read oscillators like RSI, MACD, and Stochastic can make trading decisions clearer and more confident.
Used with a sound trading strategy, these tools can help you time your entries and exits more effectively — and take your trading journey to the next level.

Read more

WikiFX Wishes You a Happy New Year!
Dear Global Users, Thank you for journeying alongside WikiFX. Every query you make, every review you share, and every piece of feedback you provide serves as the most vital driving force behind our continuous efforts to promote transparency and security in the trading industry.

Celebrate the New Year and Usher in a Safer 2026 for All Traders!
As the new year begins, WikiFX extends our sincere gratitude to traders worldwide, our industry partners, and all users who have consistently supported us.

Become a Broker Reviewer: Your Experience is Worth Its Weight in Gold
Dear Forex Traders, When choosing a forex broker, have you ever faced these dilemmas? Dozens of broker advertisements, but unsure which one is truly reliable? Online reviews are either promotional content or outdated/incomplete? Want to learn about real users’ deposit/withdrawal experiences but can’t find firsthand accounts? Now, your experience can help thousands of traders and earn you generous rewards! The campaign is long-term and you can join anytime.
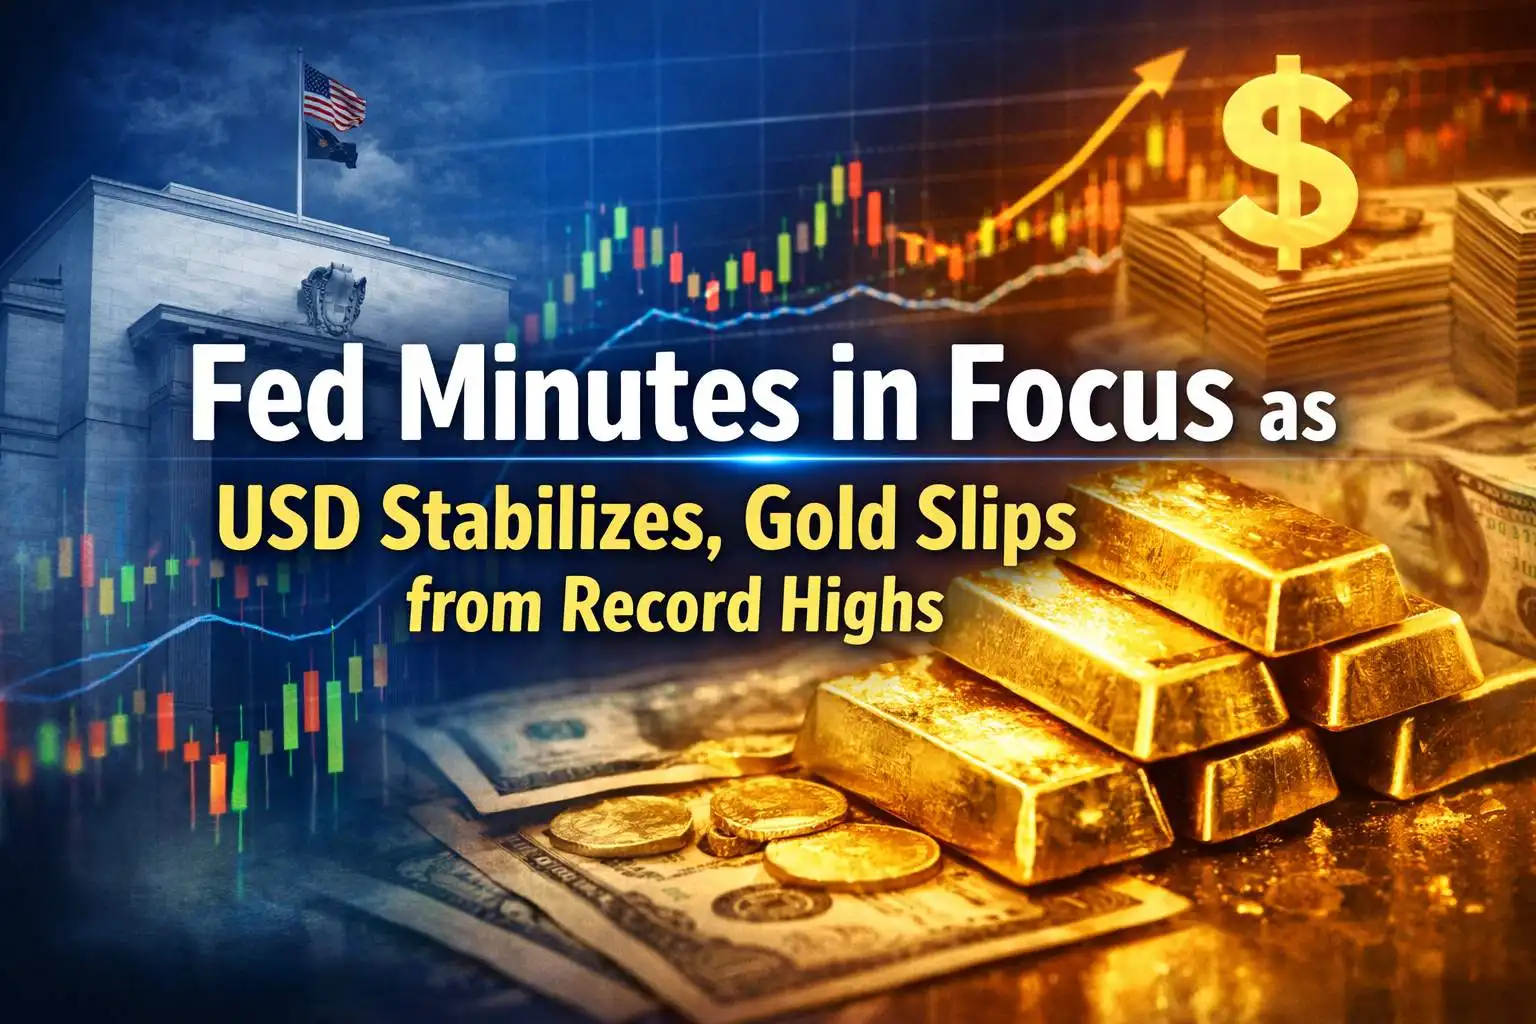
Fed Minutes in Focus as USD Stabilizes, Gold Slips from Record Highs
Markets turn cautious as investors await the Fed’s December meeting minutes. The US Dollar stabilizes near 98.10, gold drops sharply from record highs, while GBP/USD, EUR/USD, and USD/JPY react to central bank signals.
WikiFX Broker
Latest News
2025 Global Economic Year in Review: How Tariffs and AI Rewrote the Playbook
WikiFXForex Daily: USD/JPY and AUD/USD Falter as Year-End Liquidity Thins
WikiFXIt’s a Scam, Not Romance: How This Woman Lost US$1 Million
WikiFXGold and Silver Plummet from Record Highs as Profit-Taking Sweeps the Market
WikiFXCrude Oil Surges as US Strikes Venezuela Facility and Ukraine Talks Stall
WikiFXHe Thought He Was Investing BUT US$500,000 Disappeared!
WikiFXFed Watch: Powell Sounds Alarm on "Excessive" Valuations
WikiFXUS Dollar on Edge: Fed Minutes and Trump Attacks Rattling Central Bank Independence
WikiFXWM Markets Review (2025): Is this Broker Safe or a Scam?
WikiFXIs ehamarkets Legit or a Scam? 5 Key Questions Answered (2025)
WikiFXRate Calc

