AI Bubble Concerns Resurface as Equity Markets Undergo Valuation Reset
Abstract:On the 17th, Oracle‘s share price fell another 5.4%, reigniting market concerns over a potential AI bubble. However, amid the recent equity market pullback, a closer look at the December U.S. Fund Man
On the 17th, Oracle‘s share price fell another 5.4%, reigniting market concerns over a potential AI bubble. However, amid the recent equity market pullback, a closer look at the December U.S. Fund Manager Survey (FMS) released by Bank of America provides a more constructive signal. The survey shows that fund managers’ cash allocations declined to a record low of 3.3%, while technology sector exposure saw a notable rebound. These signals offer reassurance regarding the broader market outlook. Below, we provide a deeper interpretation of the latest FMS findings.
According to international media reports, Blue Owl Capital, Oracles largest data center financing partner, withdrew its funding support. The original plan involved developing a data center exceeding 1GW in capacity in Saline Township, Michigan. The partnership collapse resulted in Blue Owl Capital pulling out of a USD 10 billion data center project, which had been intended to provide dedicated computing capacity for OpenAI.
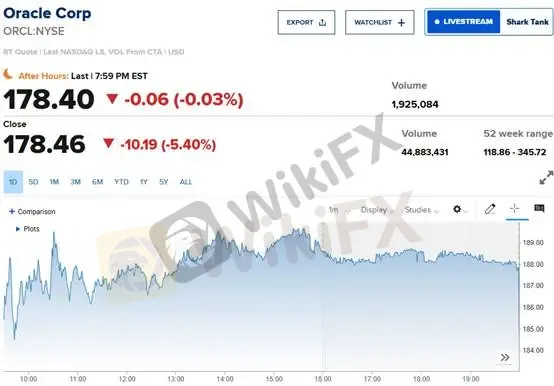
(Figure 1: Oracle shares decline 5.40% on negative news flow; Source: CNBC)
Despite technology stocks being accumulated by FMS fund managers in December, the equity market experienced a sharp correction shortly thereafter. With cash allocations now at just 3.3%, the key concern is whether managers may be forced into rapid deleveraging.
From our perspective, this risk appears limited. The low cash level itself is not a cause for immediate concern. The FMS primarily reflects long-only institutional investors, who typically reduce exposure aggressively only when there is a clear trend reversal or a fundamental deterioration at the company level. It is unlikely for long-only managers to initiate significant selling immediately after building positions, as their large asset bases often place them in the role of price setters rather than price takers.
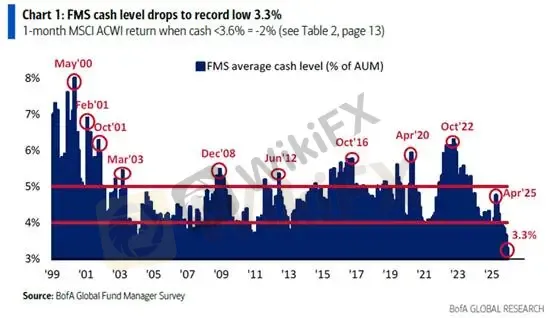
(Figure 2: FMS fund managers cash allocation as a percentage of total assets in December; Source: BofA)
Looking at the macroeconomic outlook over the next 12 months, expectations for a hard landing declined to 3%, while the probability of a soft landing increased from 53% to 57%. The likelihood of a no-landing scenario remained unchanged at 37%.
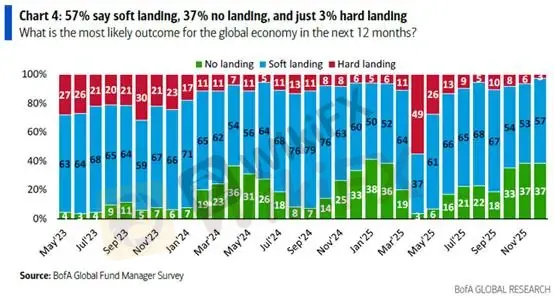
(Figure 3: FMS fund managers outlook on future economic scenarios; Source: BofA)
Concerns over an AI bubble have also eased modestly among fund managers, falling from 45% to 38%. Meanwhile, 19% of respondents identified rising bond yields as the most significant tail risk facing markets.
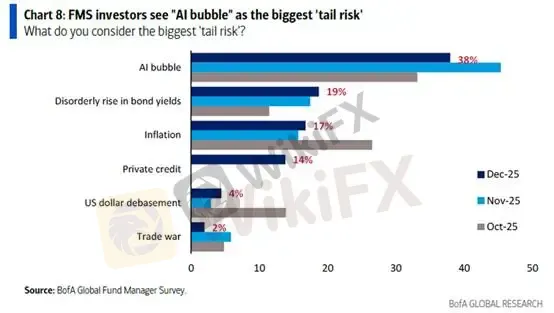
(Figure 4: FMS shows a modest decline in AI bubble concerns; Source: BofA)
Examining the monthly positioning changes, December saw fund managers significantly reduce bond exposure, while modestly trimming holdings in healthcare, the euro, consumer staples, banking stocks, and cash.
Notably, 24% of respondents reported increasing allocations to technology stocks, a pace of accumulation that appears more aggressive compared with the 2010–2020 period.
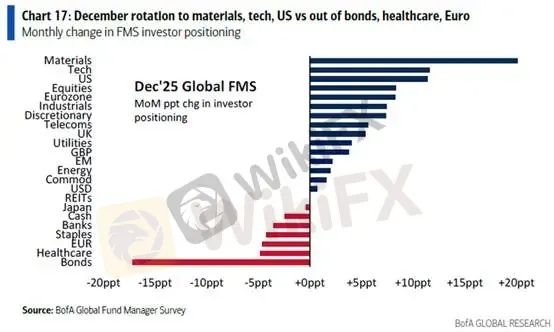
(Figure 5: Monthly changes in FMS fund manager positioning; Source: BofA)
From a Z-score perspective, technology sector positioning has now moved close to a neutral level, narrowing sharply from –0.6 standard deviations in November. In the short term, concentrated positioning may raise the risk of crowded trades. However, from a medium-term standpoint, technology exposure remains far from excessive, with allocations merely returning to historical neutrality rather than overextension.
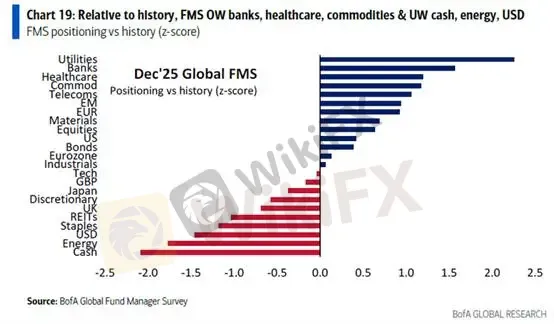
(Figure 6: Historical Z-score distribution shows technology positioning near neutral; Source: BofA)
Consistent with our previous view, we maintain that short-term market dislocations are unlikely to alter the broader trend. Against the backdrop of Federal Reserve rate cuts and quantitative easing, the structural trend of equities and gold rising in tandem remains intact.
Gold Technical Analysis
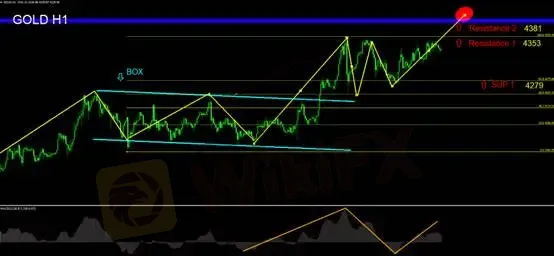
Gold is once again testing the 4,353 resistance level. The key intraday focus is whether this level can be decisively broken. If bullish momentum fails to extend during the Asian session, prices are more likely to trade in a choppy, range-bound pattern, with a sharp downside move appearing unlikely at this stage.
On the downside, initial support is seen near 4,279 (SUP1), which corresponds to the 38.2% Fibonacci retracement level.
Later today, CPI data will be released. Our scenarios are as follows:
CPI above market expectations: Increased risk-off flows into gold, supportive for gold prices.
CPI below market expectations: Strengthens expectations for at least two rate cuts next year, bullish for both gold and equities.
Key Levels
Support
SUP1: 4,279
Resistance
Resistance 1: 4,353
Resistance 2: 4,381
Risk Disclaimer
The views, analyses, research, prices, or other information provided above are for general market commentary only and do not represent the position of this platform. All readers assume full responsibility for their own risk. Please trade with caution.

WikiFX Broker
Latest News
Yen Surges on Pension Plan and Strong Inflation
 WikiFX
France’s AMF Warns Against 16 Unauthorized Online Investment Entities
WikiFXCan Meta Escape a US$610 Million WhatsApp Scam Lawsuit?
WikiFXHow the 3-Bullet Card Stops Forex Overtrading
WikiFXTRADE.COM Review 2026: Regulatory Status and Severe Withdrawal Complaints
WikiFXBank Customers Win Back RM211,000 After Insider Fraud
WikiFXFunding Pips Review 2026: Is This Forex Broker Safe?
WikiFXCash, Luxury and Live Streams: Malaysian Police Tighten Watch on Social Media Millionaires
WikiFX⚽💱 World Cup · Forex Predict & Win Event
WikiFXWikiEXPO Hong Kong 2026 Set to Open, Bringing Together Global Fintech Leaders to Explore the Future
WikiFXRate Calc

