Crypto market forecasting with indicators
Abstract:Cryptocurrency trading has gained a lot of traction in the past few years and has forged a niche of its own. Most investors hold Bitcoin and stake cryptocurrencies for long periods, hoping to see their investments grow without too much fuss. However, an increasing number of investors spend time and resources trying to make a living out of crypto trading.

Cryptocurrency trading has gained a lot of traction in the past few years and has forged a niche of its own. Most investors hold Bitcoin and stake cryptocurrencies for long periods, hoping to see their investments grow without too much fuss. However, an increasing number of investors spend time and resources trying to make a living out of crypto trading.
Nevertheless of the the bullish moment the crypto market had been through, yet crypto market is showing signs of life, and 2023 might just be a great time to trade your favorite coins. But before the market gets into full swing, why not brush up on the best indicators for crypto market technical analysis?
The below indicators are commonly available on most crypto trading platforms and crypto trading apps. Stay for the final words in this article to get the most out of your crypto trading this year. Let‘s get started with the first indicator on the list—and it’s a big deal.
Bollinger Bands
A Bollinger Band consists of a middle band (which is a moving average) and an upper and lower band. These upper and lower bands are set above and below the moving average by a certain number of standard deviations of price, thus incorporating volatility. Bollinger Bands aim to show how crypto market prices are spread around an average value. They are defined by two trendlines (one negative, one positive) plotted at a distance of two standard deviations from a simple moving average (SMA). These bands can indicate support and resistance levels.
The standard deviation measures crypto market volatility by comparing prices to the average (SMA). Bollinger Bands usually uses a 20-day period and two standard deviations for the lower and upper bands, but the settings can be adjusted.
When prices approach the upper band, it signals an overbought crypto market as the price grows abnormally. If the price drops toward the lower band, it's considered oversold. The bands' contraction or expansion shows the market's volatility level.
Combining with the Moving Average Convergence/Divergence (MACD) indicator is a helpful method that provides trading signals. When the MACD line crosses above zero, it signals a bullish trend and is a good entry point. When it crosses below zero, it indicates a bearish trend and is a good exit point.
Ichimoku Cloud
The Ichimoku Cloud is a collection of technical indicators that show support and resistance levels, as well as momentum and trend direction. The Ichimoku Cloud consists of five lines – the Tenkan-sen, Kijun-sen, Chikou Span, Senkou Span A, and Senkou Span B. These lines are plotted on the chart using historical price data.
The cloud formed by the two Senkou Span lines acts as a dynamic support or resistance level. If the crypto asset price is above the cloud, it indicates an uptrend, and if the price is below the cloud, it indicates a downtrend.
Use the Tenkan-sen and Kijun-sen lines as momentum indicators when forecasting the crypto markets: The Tenkan-sen line represents short-term momentum and the Kijun-sen line represents longer-term momentum. If the Tenkan-sen line is above the Kijun-sen line, it signals bullish momentum, and if it is below the Kijun-sen line, it signals bearish momentum.
Use the Chikou Span as a lagging indicator: The Chikou Span is plotted 26 periods behind the current price and acts as a lagging indicator. When the Chikou Span is above the price, it signals bullish sentiment forming in the crypto market, and when it is below the price, it signals bearish sentiment.
Fibonacci Retracement
Fibonacci retracement levels are useful tools for traders to identify potential turning points in crypto prices. They are horizontal lines at levels of 23.6%, 38.2%, 61.8%, and 78.6% derived from Fibonacci's sequence.
Traders can use these levels to determine support and resistance points in a price chart. For instance, if the price bounces off a Fibonacci support level during an uptrend, it may be a good entry point. A resistance level can be an exit point when a trader takes profit and closes a trade in anticipation of a reversal.
An established breakout on support or resistance can also serve as a good entry point when bitcoin trading (and most other high market cap coins) in the direction of the trend, as the broken support becomes resistance and vice versa.
Relative Strength Index (RSI)
The RSI is a momentum indicator that measures the speed and magnitude of crypto price changes by evaluating oversold and overbought conditions.
The RSI formula ranges from 0 to 100, and an asset is considered oversold below 30 and overbought above 70. During sustained crypto trends, the indicator may remain in overbought or oversold territory for extended periods.
The RSI indicator on the chart is signified by a line moving between two parallel lines and can indicate divergence signals for bullish or bearish market conditions or for an exaggerated divergence.
Moving Averages (MA)
MA is a commonly used tool for Bitcoin trading and crypto market forecasting in general as a lagging indicator. The Moving Average Method shows the average price of a given number of recent candles and helps smooth out price action over a set period of time.
As a crypto trader, you can adjust the number of periods you want to consider in the moving average indicator. One period represents a unit of time, based on the chart's observed time frame.
The choice of MA periods depends on your trading style, with popular options being the 20-period, 50-period, and 200-period time frames. This allows traders to determine the general direction of the crypto asset based on the data set over time.
Crypto daytraders often prefer the 20-period MA due to its shorter time frame, while long-term coin holders may prefer the 200-period MA for better monitoring of crypto market trend identification. Regardless, MA provides a good indication of support and resistance levels.
Stochastic Oscillator (SO)
Stochastic Oscillator is a leading indicator used to determine the momentum strength of a crypto market trend. It compares the asset's closing price with its high-low range over a set period and performs well even in the volatile cryptocurrency market. The speed of its reaction can be adjusted.
The Stochastic Oscillator ranges between 0 and 100, with values below 20 indicating oversold, and values above 80 indicating an overbought crypto market. During a strong crypto market trend formation, oversold or overbought conditions may only lead to consolidation in sideways price movement. The crossing of the %K line to the %D line signals an incoming upward trend, as the intersection implies a significant day-to-day momentum shift.
The last piece of the puzzle
Using indicators to forecast the crypto market is a lot like forecasting the weather. Forecasting models and signals can give you a rough idea of what to expect on the day, but conditions can change hour by hour, and during those temporary fluctuations, your trading account can suffer.
Indicators give a big-picture forecast, but rarely predict the rapid moves that commonly occur after fundamentals or news reports. When a mainstream media giant goes hawkish, many trading news sites blindly follow, and a sentiment trend forms among crypto traders everywhere… usually within a single day.
We need to know that Indicators cannot plot sentiment shifts, so its recommended to include fundamental analysis for your entry points, and use technical indicators to help identify exit points. Indicators are also ideal for plotting Take Profit & Stop Loss settings, and analyzing the price range so you can set leverage at appropriate levels. If the 24-hour range is a little wild, high leverage will present a serious risk to your equity, so be modest with your profit targets when trading any of the cryptocurrencies.


Read more
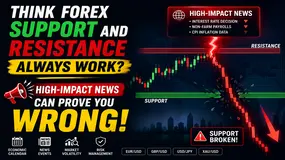
Think Forex Support and Resistance Always Work? High-Impact News Can Prove You Wrong!
Forex traders often have to come to terms with these two popular concepts - Support and Resistance. A support level refers to the point where buyers have historically come together to prevent the price from sliding further. On the other hand, the point of resistance is where sellers have historically limited upward movement. These two levels form the foundation of many trading strategies employed by traders to spot entry, exit and stop-loss points. However, many beginners begin to think that these price levels are unbreakable. Such assumptions can go horribly wrong during high-impact economic news releases such as inflation reports, employment data, monetary policy announcements by the central bank or any other major news events. These events can trigger price movements so much that even the strongest support and resistance levels can crack within seconds.
Centinary Review 2026: I Earned $496,000, but Was I Able to Receive It? Read This Report!
Centinary, a new age broker, has managed to receive quite a bit of user reviews recently. However, all these reviews accuse the broker of robbing users’ funds. From loss of yuan to dollar, traders have been complaining about the alleged hassles faced while withdrawing funds from the Centinary platform. In this Centinary review article, we will take you through the complaints users have made in 2026.

One Lot Size Mistake Can Cost You Thousands—Here's Where the 1% Rule Helps
Switched from one trading strategy to another but could not avert heavy losses? Wondering what went wrong despite your market analysis being spot on? It may not be a strategic issue then. It may just be that you chose the wrong lot size. Yes, a single oversized position can get your account exposed to far greater risks than you may imagine. You may be moved by the impressive profits with increasing lot sizes. But by doing so, you also invite a proportionate rise in losses. This is where you need to apply the essential 1% risk management principle. This rule helps you assess how much you can afford to lose if a trade does not go as planned.

TRANS X MARKETS Review 2026: I Lost as Much as $40K. One of Many Verified User Allegations
This allegation representing fund loss worth $40,000 came from a verified Indian user on a trusted platform such as WikiFX. However, this is not the only allegation from users across India and other regions. Many verified users have complained about the loss of access to withdraw profits from the TRANS X MARKETS platform. At the same time, we came across complaints about the withdrawal issue from the free software provided by the brokerage firm. In this TRANS X MARKETS review, we have examined these allegations while also giving you the company’s regulatory background.
WikiFX Broker
Latest News
Yen Surges on Pension Plan and Strong Inflation
 WikiFX
France’s AMF Warns Against 16 Unauthorized Online Investment Entities
WikiFXCan Meta Escape a US$610 Million WhatsApp Scam Lawsuit?
WikiFXHow the 3-Bullet Card Stops Forex Overtrading
WikiFXTRADE.COM Review 2026: Regulatory Status and Severe Withdrawal Complaints
WikiFXBank Customers Win Back RM211,000 After Insider Fraud
WikiFXFunding Pips Review 2026: Is This Forex Broker Safe?
WikiFXCash, Luxury and Live Streams: Malaysian Police Tighten Watch on Social Media Millionaires
WikiFX⚽💱 World Cup · Forex Predict & Win Event
WikiFXWikiEXPO Hong Kong 2026 Set to Open, Bringing Together Global Fintech Leaders to Explore the Future
WikiFXRate Calc

