SILVER PRICE ANALYSIS: XAG/USD’S ADVANCE HALTS AND FINDS SUPPORT AT THE 20-DAY SMA
Abstract:On Tuesday, the XAG/USD Silver spot price significantly dropped, mainly due to the USD strength. Attention is on labour market data released as investors are modelling their expectations towards the next Federal Reserve (Fed) meeting. Meanwhile, the greenback trades strong agains most of its rivals, with the USD DXY index rising towards the 102.30 area.

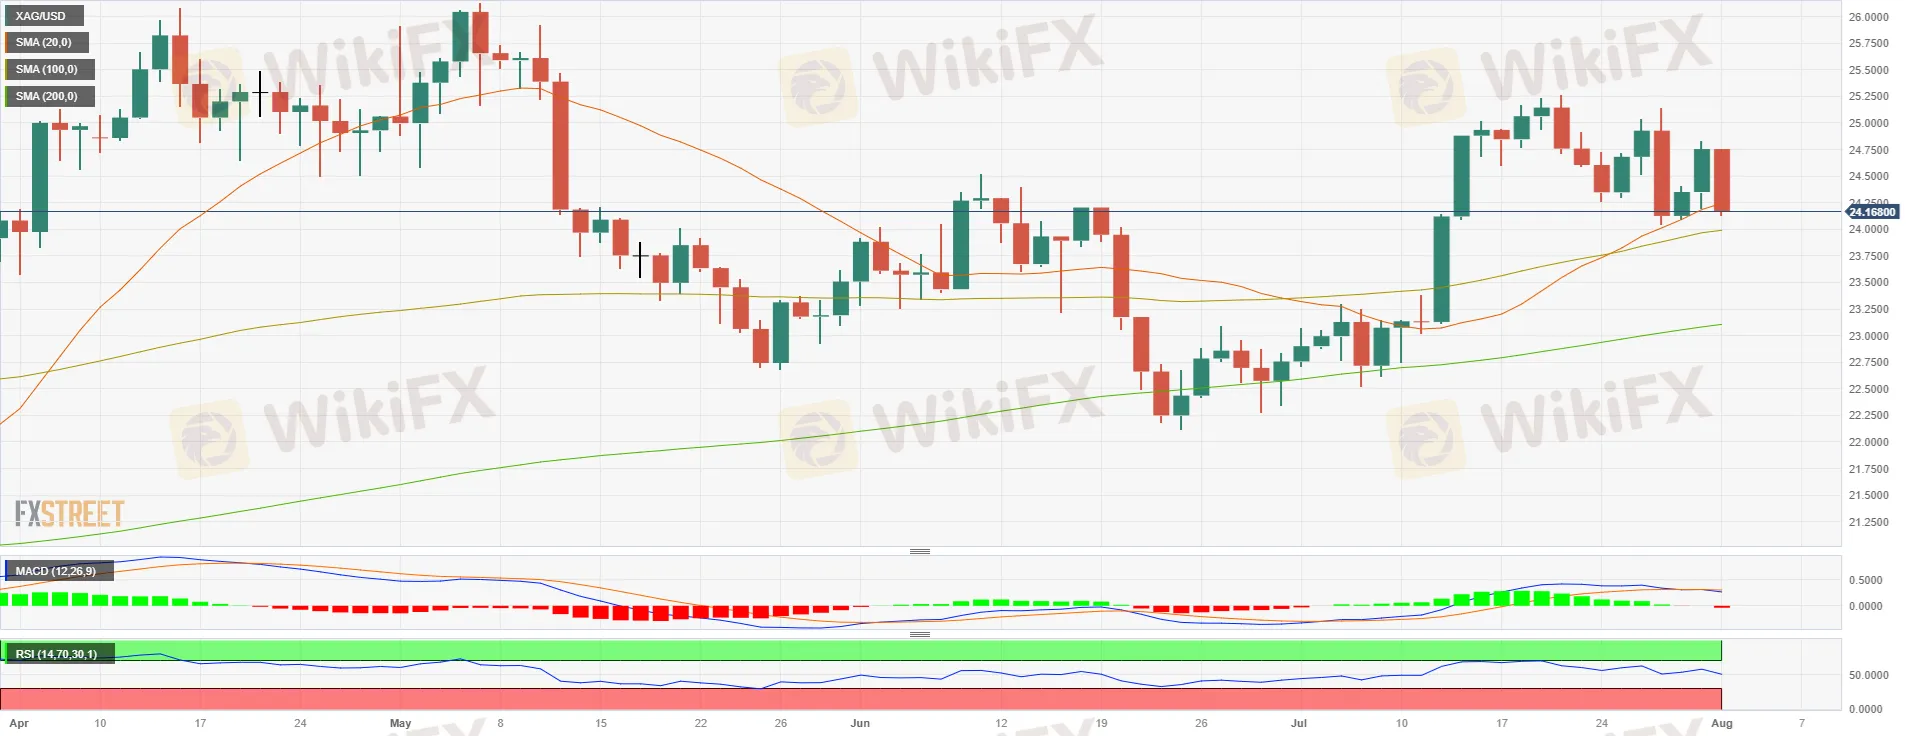
• XAG/USD retreated more than 1% towards the $24.20 area, still holding the 20-day SMA.
• USD is strong after the release of Junes JOLTS Job Opening and the ISM Manufacturing PMI.
• Rising US Treasury yields are not allowing metals to find demand.
On Tuesday, the XAG/USD Silver spot price significantly dropped, mainly due to the USD strength. Attention is on labour market data released as investors are modelling their expectations towards the next Federal Reserve (Fed) meeting. Meanwhile, the greenback trades strong agains most of its rivals, with the USD DXY index rising towards the 102.30 area.
The US ISM July PMI came in slightly below expectations at 46.4 but higher than the previous reading of 46. JOLT's Job Openings missed expectations at 9.58M below the 9.62M. Its worth pointing out that Fed Chairman Powell stated that the economy holds resilient, but future decisions depend on incoming data, causing potential volatility in USD price dynamics on data releases. In that sense ADP job employment change, Jobless Claims, and Nonfarm Payrolls will be closely monitored this week for investors to start placing their bets on the next Fed meetings.
In the meantime, US yields are rising, which could be seen as the opportunity cost of holding non-yielding metals, are rising across the board. The 2-year yield remains steady at 4.88% while the 5 and 10 rates are at 4.22% and 4.02%, respectively, increasing more than 1%. In addition, the CME FedWatch tool indicates that investors are not so confident about a hike in September as their odds stand near 20% while the probabilities in November top out near 40%.
XAG/USD LEVELS TO WATCH
As per the daily chart, the technical outlook for XAG/USD is shifting towards neutral to bearish, with signs of bullish exhaustion becoming evident. The Relative Strength Index (RSI) displays a negative slope above its midline, while the Moving Average Convergence Divergence (MACD) exhibits fading green bars. Furthermore, the pair is above the 20,100,200-day SMAs, suggesting that the bulls are firmly in control of the bigger picture.
Resistance levels: $24.90,$25.00, $25.30.
Support levels: $24.15 (20-day SMA), $24.00, $23.80
XAG/USD DAILY CHART


Read more

Voices of the Golden Insight Award Jury | Dennis Yeh, Head of Asia Pacific Region at Taurex
WikiFX Golden Insight Award uniting industry forces to build a safe and healthy forex ecosystem, driving industry innovation and sustainable development, launches a new feature series — “Voices of the Golden Insight Awards Jury.” Through in-depth conversations with distinguished judges, this series explores the evolving landscape of the forex industry and the shared mission to promote innovation, ethics, and sustainability.

AMarkets Updated Review: Is This Established Broker Still a Good Choice in 2025?
In a competitive online trading space, few companies can claim a history as long as AMarkets. Started in 2007, this broker has helped over three million clients and built a strong presence, especially in CIS, Asian, and Latin American markets. What makes it appealing is clear right away: very high leverage, many different account types, and an excellent 4.8-star rating on Trustpilot based on reviews from over 3,000 users so far. These features show a popular and seemingly trustworthy trading partner. However, a closer look shows a basic problem that traders may face. Behind the attractive features and positive user opinions lies a major concern: AMarkets works only under offshore regulation. It doesn't have licenses from any top-level regulatory bodies like the FCA (UK), ASIC (Australia), or CySEC (Cyprus). This AMarkets Review 2025 aims to break down this contradiction. We will provide a complete analysis based on verified facts, looking at the broker's safety measures, trading condi

Year of the Fire Horse 2026: Which Zodiac Signs Have the Strongest Money Luck in Trading?
The year 2026 is expected to be a period of high volatility in the forex market, which from an astrological perspective is viewed as an opportunity for traders who maintain discipline and manage risk effectively. Four zodiac signs stand out in terms of financial prospects: Cancer, which is well suited for long-term trading; Aries, which favors short-term trading but requires strong emotional control; Taurus, which shows strength in generating supplementary income within the trading industry; and Libra, which is best aligned with systematic, rule-based trading. However, astrology serves only as a psychological support tool. True success in trading ultimately depends on a trader’s planning, discipline, and risk management rather than luck alone.

【Inside the Elite Committee】Talk with Mohamed Lewaa
WikiFX has launched the “Inside the Elite” Interview Series, featuring outstanding members of the newly formed Elite Committee. During the committee’s first offline gathering in Dubai, we conducted exclusive interviews and gained deeper insights into regional market dynamics and industry developments. Through this series, WikiFX aims to highlight the voices of professionals who are shaping the future of forex trading — from education and compliance to risk control, technology, and trader empowerment.
WikiFX Broker
Latest News
Year of the Fire Horse 2026: Which Zodiac Signs Have the Strongest Money Luck in Trading?
Stop Trading: Why "Busy" Traders Bleed Their Accounts Dry
Stop Chasing Green Arrows: Why High Win Rate Strategies Are Bankrupting You
Should You Delete Every Indicator from Your Charts? Let’s Talk Real Trading
Is ZarVista Legit? A Critical Review of Its Licenses and Red Flags
Scam Victims Repatriated: Malaysia Thanks Thailand’s Crucial Help
Why You’re a Millionaire on Demo but Broke in Real Life
Cabana Capital Review 2025: Safety, Features, and Reliability
XTB Review 2025: Pros, Cons and Legit Broker?
Voices of the Golden Insight Award Jury | Dennis Yeh, Head of Asia Pacific Region at Taurex
Rate Calc


